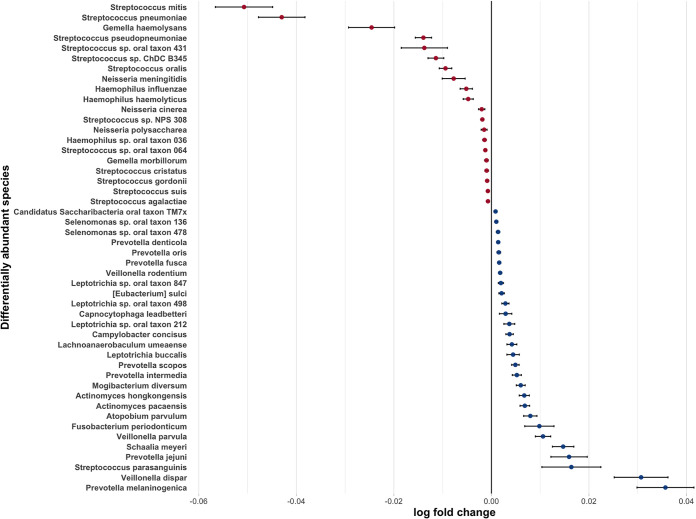
FIG 6.
Species showing a significant difference in abundance in samples with a high versus low abundance of beta-lactam resistance genes. The relative abundances of species identified as differentially abundant, in samples with a high versus low abundance of beta-lactam resistance genes, by ANCOM-BC. Effect sizes were estimated via log fold (natural log) change in relative abundance of each species between high and low. Taxa more abundant in the high-beta-lactam RGPC group have an effect size shifted to the left and are shown in red, whereas taxa more abundant in the low-beta-lactam RGPC group have an effect size shifted to the right and are in blue.

