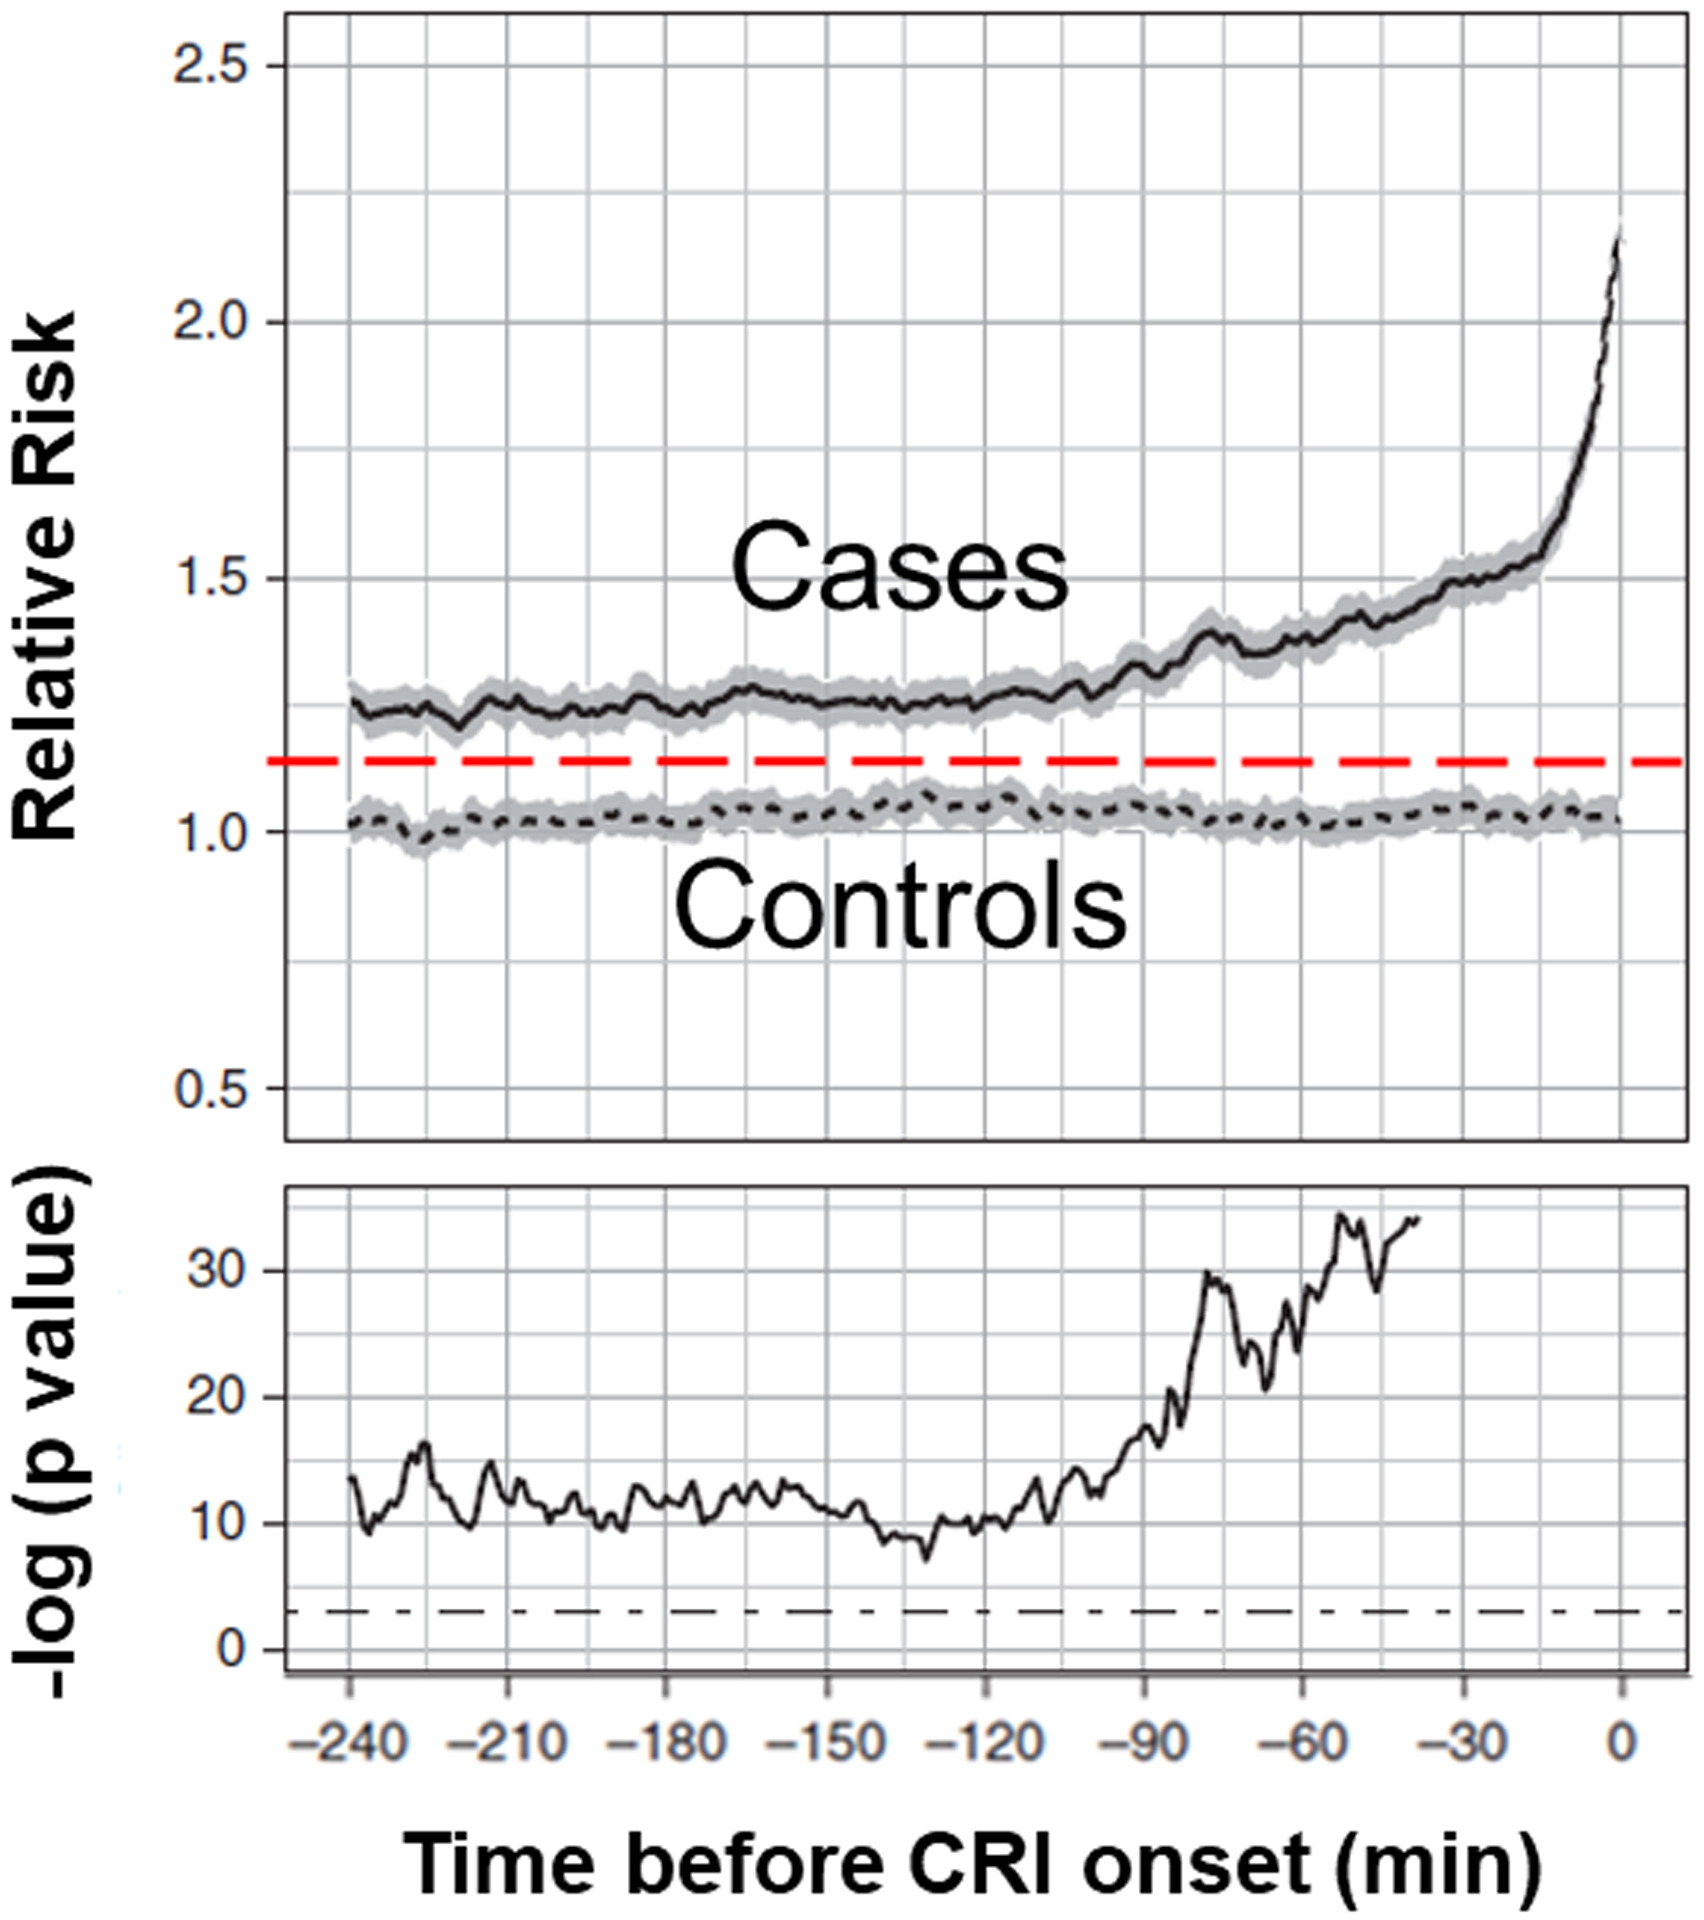
Figure 1: Relative Cardiorespiratory Insufficiency Risk Sub-trajectories.

Relative cardiorespiratory insufficiency (CRI) risk sub-trajectories aggregated separately for case (solid lines) and control (dotted lines; gray areas represent 95% confidence intervals) patients 4-hours immediately before CRI onset. Time index 0 corresponds to time of CRI. In the bottom plot we show the P value series computed from two-sample t tests at each time point shown on the logarithmic scale. The cutoff threshold of 5% significance is shown with dot–dash straight lines.
Reprinted with permission Chen L, Olufunmilayo O, Clermont G, Hravnak M, Pinsky MR, Dubrawski AW. Dynamic and personalized risk forecast in step-down units: Implications for monitoring paradigms. Annals of the American Thoracic Society. 2017 Mar;14(3):384–391. doi: 10.1513/AnnalsATS.201611-905OC. PMID: 28033032
