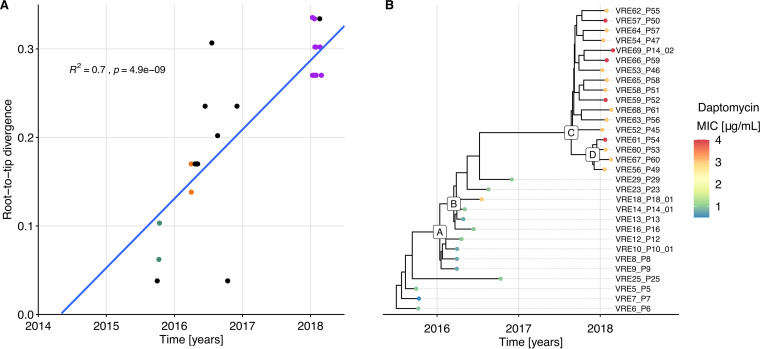
FIG 2.
Vertical evolution of the persistent clone. (A) Regression of the root-to-tip divergence against sampling date, based on the phylogeny resulting from the recombination-free SNP alignment of the isolates from the persistent clone. R2 and P values are based on a Pearson correlation. Divergence is based on the 32-bp SNP alignment, so 0.32 corresponds to 10 SNPs. Dots corresponding to isolates from patients with an established epidemiological link share the same color, e.g., all but one of the 2018 outbreak’s isolates are in purple. All isolates from patients without established epidemiological link are in black. (B) Time-scaled maximum clade credibility (MCC) tree inferred by Bayesian analysis. The color of the dots marking the tips of the phylogeny reflects the degree of susceptibility to daptomycin (MIC). Letters labeling selected internal nodes are meant as a reference to specific clades, referred to in Data Set S1, Tab 5.

