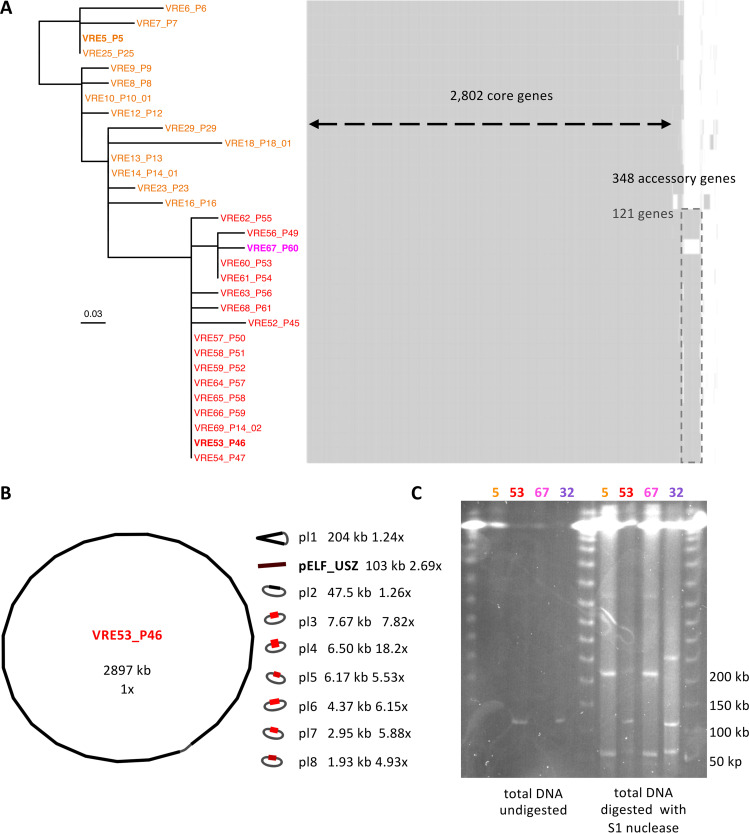
FIG 3.
Content and structure of the genome of isolates representing the persistent clone. (A) Maximum likelihood phylogenetic tree along with gene content map. The phylogeny is based on the recombination-free SNP alignment (32 bp). The ancestral isolates are labeled in orange, the outbreak clade isolates are labeled in red, except for the only clade member that did not carry the additional mobile genetic element, labeled in magenta. The three isolates chosen as representatives for further experiments are highlighted in boldface. Each isolate has its corresponding row in the gene content map, where each column represents one gene. (B) Visualization of the complete assembly of VRE53_P46. The length of each sequence is given in kilobase pairs (kb). Next, the coverage (depth) with respect to the chromosome coverage (set to 1×) was determined. The color, ranging from black, for the chromosome, to light red reflects the coverage and a gray string indicates circularization. (C) PFGE of three representative isolates of the persistent clone: VRE5_P5, VRE53_P46 and VRE67_P60 (labeled 5, 53, and 67, respectively), as well as one isolate from cluster 6, VRE32_P32 (labeled 32). Four columns on the left, undigested total DNA; four columns on the right, total DNA digested by S1 nuclease, for plasmid linearization.

