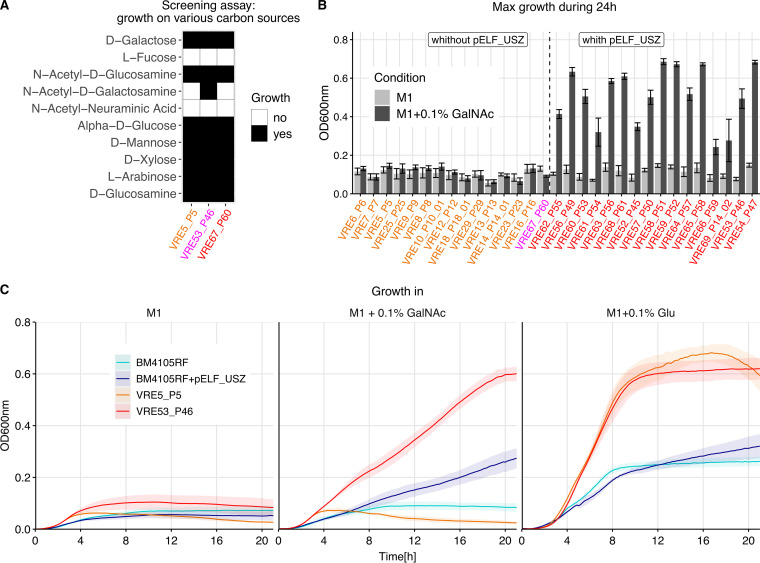
FIG 5.
Function and transferability of pELF_USZ. (A) Growth in M1 supplemented with various carbon sources for three representative isolates of the persistent clone. This screening experiment was performed with the Phenotype MicroArrays PM1 and PM2A, Biolog Inc. Growth was measured by monitoring the optical density at 600 nm (OD600) during 48 h. Conditions yielding an area under the curve above an empirically determined threshold were considered growth permissive. Here, 10 out of the 190 conditions screened are displayed, selected based on their biologic relevance: the first five are monosaccharide components of mucins, and the following five are monosaccharide components of plant polysaccharides. (B) Maximum OD600 reached by the 31 isolates of the persistent clone during 24 h of growth in either M1 only or in M1 supplemented with 0.1% GalNAc (mean and standard error of mean are displayed, N ≥ 3). The color of the labels highlights the groups previously introduced: ancestral isolates are in orange and the outbreak clade isolates are in red, except for the only clade member that did not carry pELF_USZ, which is in magenta. The isolates are ordered based on their position on the phylogenetic tree of Fig. 3A, except for VRE67_P60, shifted to be grouped with the isolates that did not carry pELF_USZ. The two groups, comprising isolates with or without pELF_USZ, differed significantly in their growth in M1 supplemented with GalNAc, Welch’s t test P = 1.17e−08. (C) Growth curves in M1, M1 supplemented with 0.1% GalNAc, and M1 supplemented with 0.1% glucose (Glu) for the recipient strain BM4105RF, the transconjugant BM4105RF+pELF_USZ, and the two representative isolates of the persistent clone, VRE5_P5, which did not carry pELF_USZ, and VRE53_P46, which did carry pELF_USZ. The average from three biological replicates is shown, and the shaded area corresponds to the standard error of the mean.

