FIG 3.
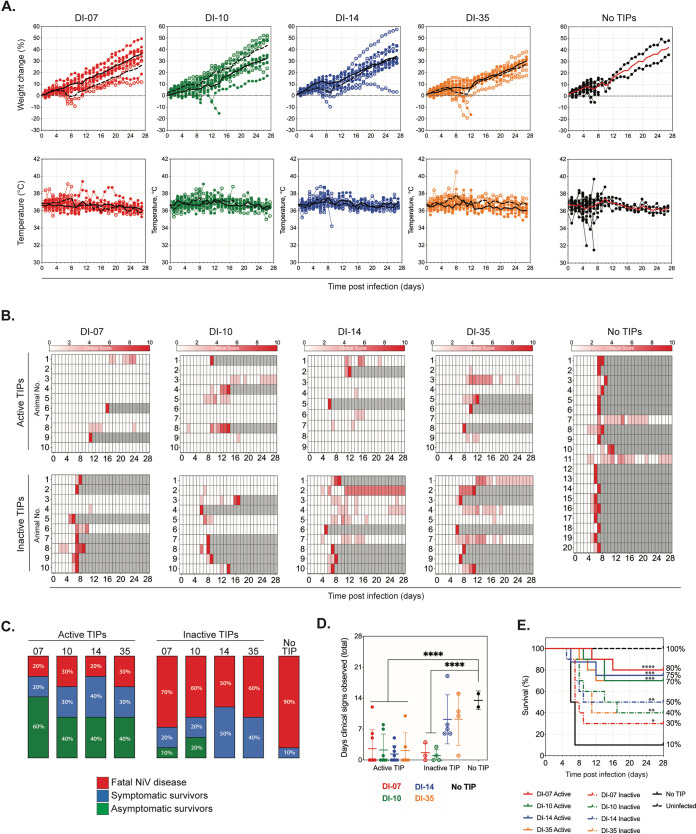
Intraperitoneal NiV challenge and treatment with active or inactive TIPs. Hamsters were inoculated i.p. with 2 mL DMEM containing 104 TCID50 NiV strain Malaysia in combination with approximately 2 × 10⁹ active TIPs (treated with 100 mJ/cm2 of UV), inactive TIPs (treated with 2,400 mJ/cm2 of UV), or no TIPs (mock treated). (A) Graphs represent percentage of weight change from baseline (taken at −1 dpi) and body temperatures. Individual animals are represented. DI-07, red; DI-10, green; DI-14, blue; DI-35, orange; no TIP (mock treated), black; closed circles represent hamsters treated with active TIPs, and open circles represent those treated with inactive TIPs. Lines indicate the mean value each day as follows: solid line for hamsters treated with active TIPs and dashed line for those treated with inactive TIPs. (B) Clinical signs (scored from 0 to 10), with severity depicted by increasing intensity of red. Animals scoring ≥10 were humanely euthanized; any animals that succumbed to disease prior to euthanasia were allocated a score of 10. Gray boxes indicate the end of monitoring/scoring due to euthanasia/death. (C) The proportion of hamsters from each group that succumbed (euthanized due to clinical signs or found dead) to NiV disease (red), those that survived to end of study at 28 dpi with having displayed at least 1 day of clinical signs (blue), or with no clinical signs (green). (D) Number of days that any hamster surviving to study end (28 dpi) exhibited clinical signs. Closed circles represent animals treated with active TIPs; open circles, those treated with inactive TIPs; and black circles, mock treated. Individual animals are represented, with lines indicating mean and standard deviation. Significance calculated by multiple t tests; ****, P ≤ 0.0001. (E) Survival of hamsters in each group. In groups containing treated hamsters, solid line represents active TIPs, and dashed line represents inactive TIPs. Significance calculated by log-rank (Mantel-Cox) test as follows: ****, P ≤ 0.0001; ***, P ≤ 0.001; **, P ≤ 0.01; *, P ≤ 0.05.

