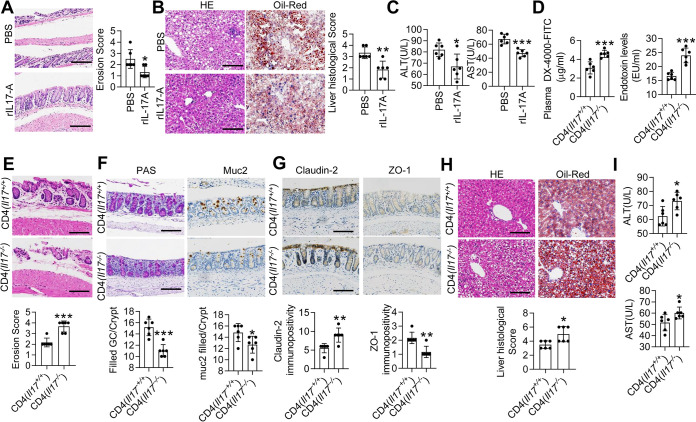
FIG 5.
IL-17 in T cells rather than innate lymphoid cells maintains the intestinal barrier. Il17−/− mice were fed an MCD diet for 1 week and then were treated with PBS or rIL17A for the following 2 weeks. (A) Representative H&E-stained colon sections. Scale bar, 50 μm. Quantification of the erosion score. (B) Representative H&E-stained (left) and Oil Red O-stained (right) liver sections from PBS- and rIL17A- treated mice. Scale bar, 50 μm. Histological scores of liver tissue from the PBS and rIL17A groups. Il17−/− mice were fed an MCD diet for 1 week and then received CD4+ T cells originating from Il17+/+ or Il17−/− mice. (C) Serum levels of ALT and AST. (D) The FITC-dextran levels in the mice that received CD4+ T cells from Il17+/+ mice and those that received CD4+ T cells from Il17−/− mice were determined. Plasma LPS concentrations were determined by ELISA. (E) Representative H&E-stained colon sections. Scale bar, 50 μm. Quantification of the erosion scores. The straight line indicates the extent of submucosal edema. (F) PAS staining (left) and immunohistochemical staining for Muc2 (right) in the colon. Scale bar, 50 μm. (G) Immunohistochemical staining for Claudin-2 (left) and ZO-1 (right) in colon tissues. Scale bar, 50 μm. (H) Representative H&E-stained (left) and Oil Red O-stained (right) liver sections. Scale bar, 50 μm. Histological scores of liver tissue. (I) Serum levels of ALT and AST. The data are expressed as the means ± SD. Significance versus mice that received CD4+ T cells from Il17+/+ mice or PBS treatment: *, P < 0.05; **, P < 0.01; ***, P < 0.01.

