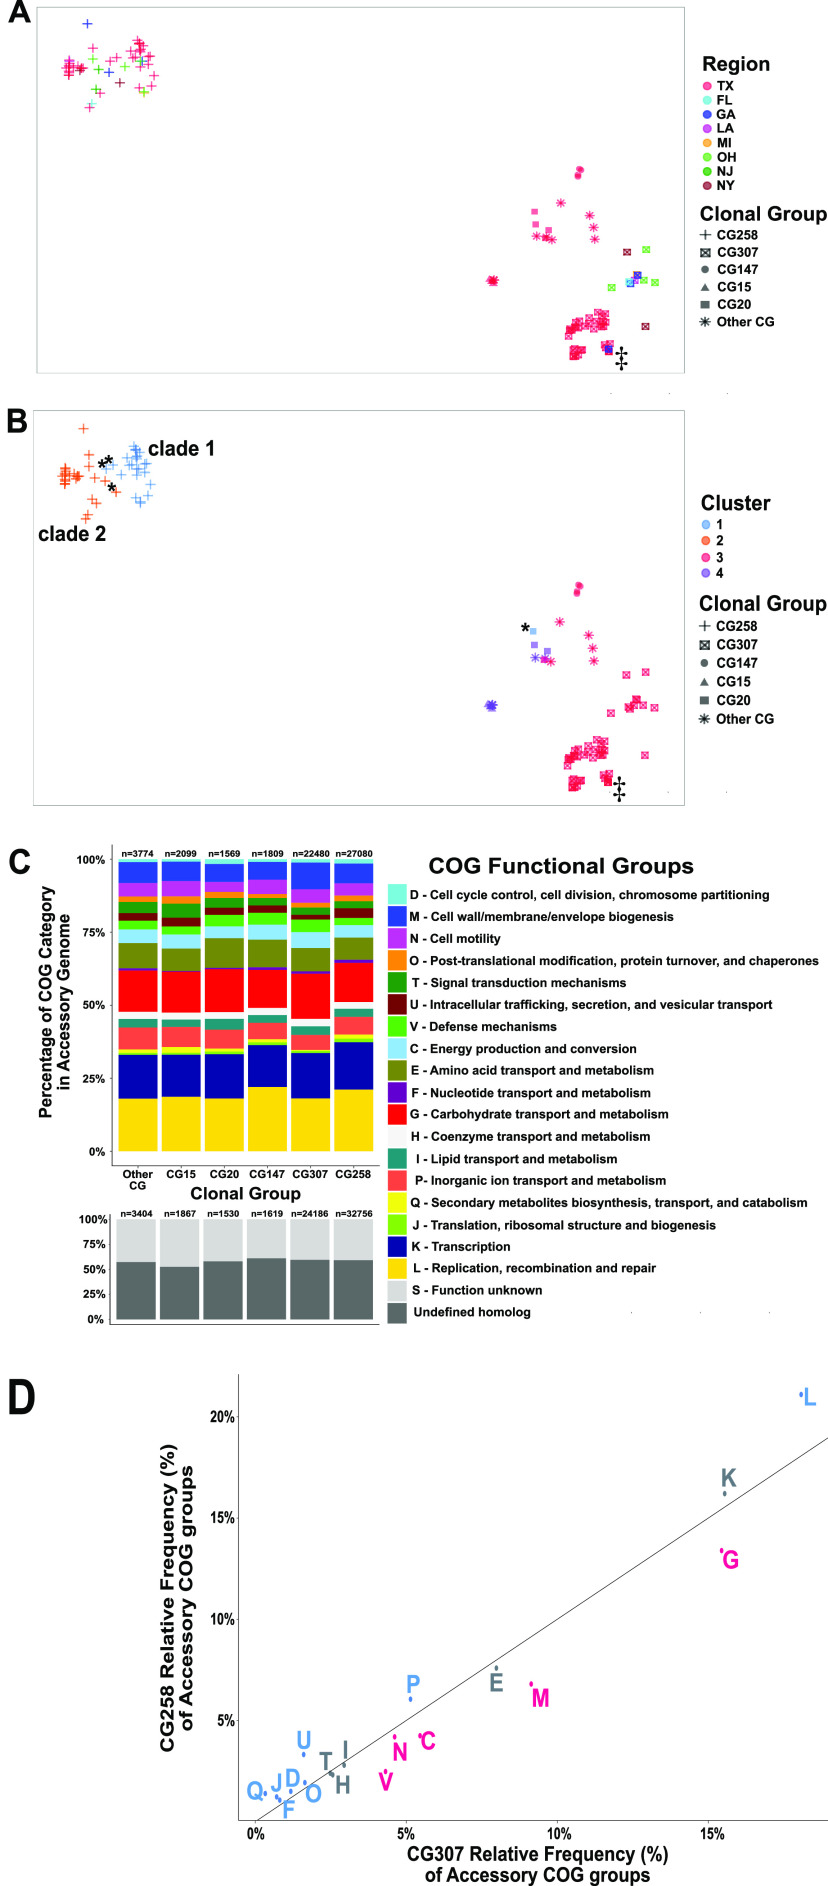
FIG 4.
Clustering of CRKP isolates with predicted protein functional characterization of the accessory genome. (A and B) t-Distributed stochastic neighbor embedding (t-SNE) two-dimensional (2-D) plot of accessory genome clustering of CRKp isolates. Clonal group is indicated by shape. ‡, Georgia isolate (C682) that clusters with Houston CG307 isolates. (A) Geographical region stratification of isolates. (B) Cluster group prediction (k = 4) using a PAM algorithm to determine cluster assignment. *, Exceptions to CG258 cluster-to-clade correlation. (C) Stacked bar chart of Cluster of Orthologous Genes (COGs) functional category proportions based on annotated genes found in the accessory genome. The n above each group indicates the absolute count of COGs identified in each clonal group per each genome. (D) The proportion of functionally annotated accessory genes differs significantly across pairwise comparisons of clonal groups as demonstrated in the scatterplot, which plots CG258 versus CG307 relative frequency proportions of COG functional groups denoted by the COG group letter (defined in panel C), with significant adjusted P values (Fisher’s exact test) indicated for a greater proportion of CG258 (blue) or CG307 (red) for each group labeled accordingly. These COG function group proportions exclude “S – unknown function” and “undefined homologs.” Nonsignificant COG functional group differences are labeled in gray.

