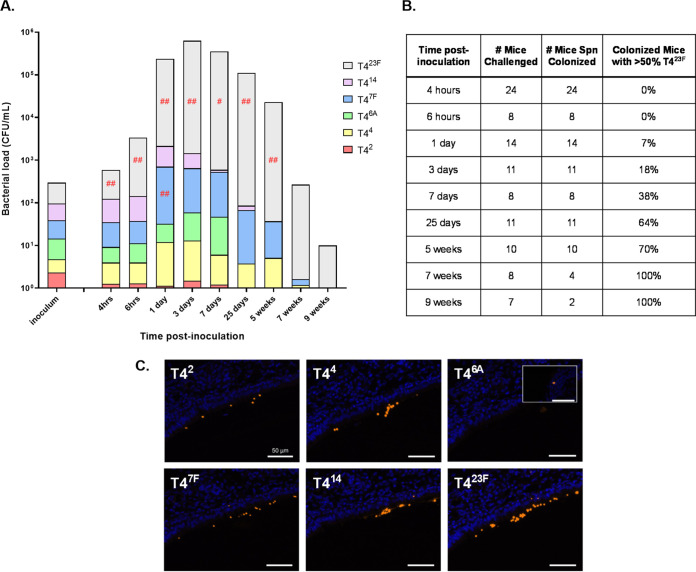
FIG 2.
Relative abundance of serotypes in multi-strain colonization over time. Pups were challenged IN at 4 days of age with an even mixture of six capsule-switch constructs at a dose of 102 CFU. (A) Bar height is the mean CFU/mL (shown in log-scale on y axis) recovered in URT lavages at the postinoculation time indicated. Each bar is divided (shown in linear scale) to represent the mean proportion out of 100% of each serotype as determined by colony immunoblotting. The inoculum is shown as total CFU delivered. Differences in serotype proportion between the lavage and inoculum were compared to a hypothetical median of 0 using the Wilcoxon Signed Rank test. (Relative serotype proportion in URT lavages was compared to the proportion present in the inoculum for a given experiment to account for slight variations during inoculum preparation.) Red symbols indicate a significant increase in serotype proportion during colonization relative to the inoculum. #, P < 0.05; ##, P < 0.01. (B) Dominance of serotype type 23F over time during multistrain colonization. The total number of mice challenged with a 6-strain inoculum for the experiments in panel A is shown. Of the mice colonized at a given time point, the percentage of mice where T423F (serotype type 23F capsule switch construct) accounts for greater than 50% of cultured Spn in lavages is shown. (C) URT tissue sections of pups challenged IN at 6–8 days of age with an even mixture of six capsule-switch constructs at a dose of 102 CFU were examined using immunofluorescence. Pups were sacrificed 24 h postinoculation and adjacent sections of fixed tissue stained for Spn (orange) with the individual serotype-specific sera indicated. Representative images are from the same site along the nasal septum in the same mouse with tissue stained with DAPI (blue). As no T46A was seen at this site, a separate image is used to document its detection (inset).

