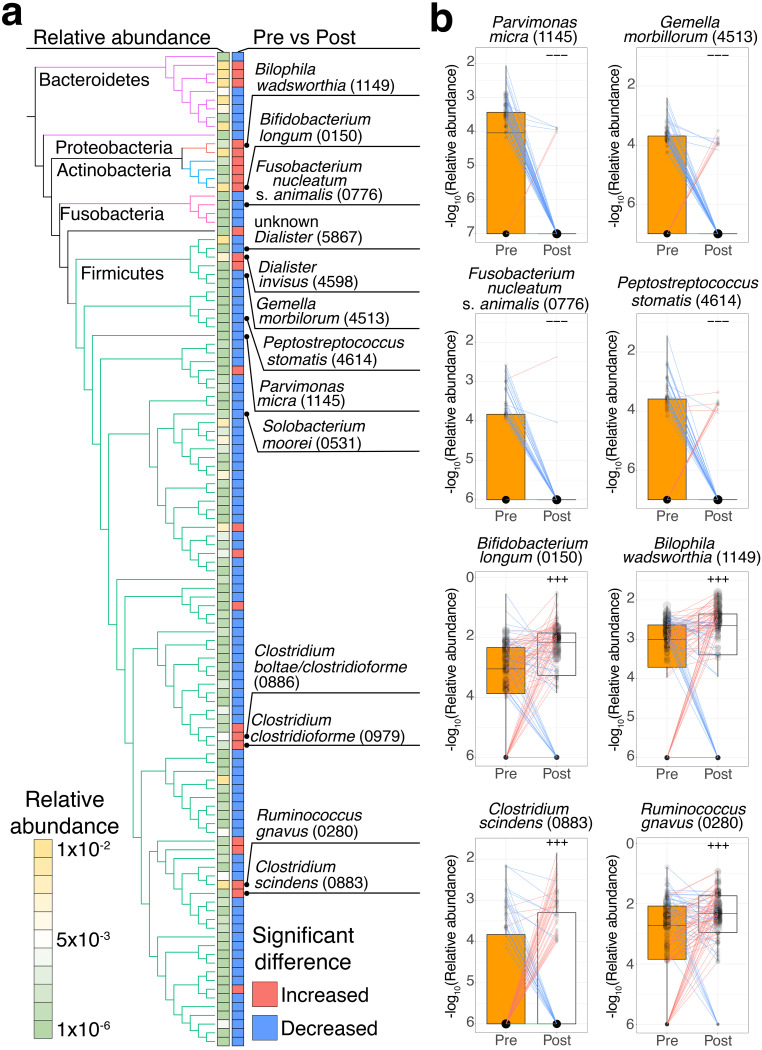
FIG 2.
Different enrichment patterns of the fecal microbiota between pre- and postsurgical treatment. (a) Comparison of the relative abundance of different species between the presurgical treatment (n = 85) and postsurgical treatment (n = 85) groups. The phylogenetic tree and two heatmaps represent a phylogenetic relationship among 114 significantly different species, their average relative abundance in pre- and postsurgical treatment samples (n = 170, legend), and their significant differences between pre- and postsurgical treatment (P < 0.005; red, increase; blue, decrease), respectively. The edges in the phylogenetic tree represent five phyla (Firmicutes, green; Fusobacteria, pink; Actinobacteria, blue; Proteobacteria, orange; Bacteroidetes, purple). (b) Each box plot shows the −log10-transformed relative abundances of species in pre- (n = 85) and postsurgical treatment (n = 85) samples (pretreatment, orange; posttreatment, white). Each line in the box plot shows alteration patterns between pre- and postsurgical treatment within samples derived from the same patients (increase, red; decrease, blue; neither increase nor decrease, green). The sizes of points in the box plot reflect the distribution of the population in each category. Significant differences characteristics are denoted as follows: +++, increase (P < 0.005); −−−, decrease (P < 0.005). One-sided Wilcoxon signed-rank test was performed to characterize the increasing or decreasing trend in the pre- and postsurgical groups in panels a and b.

