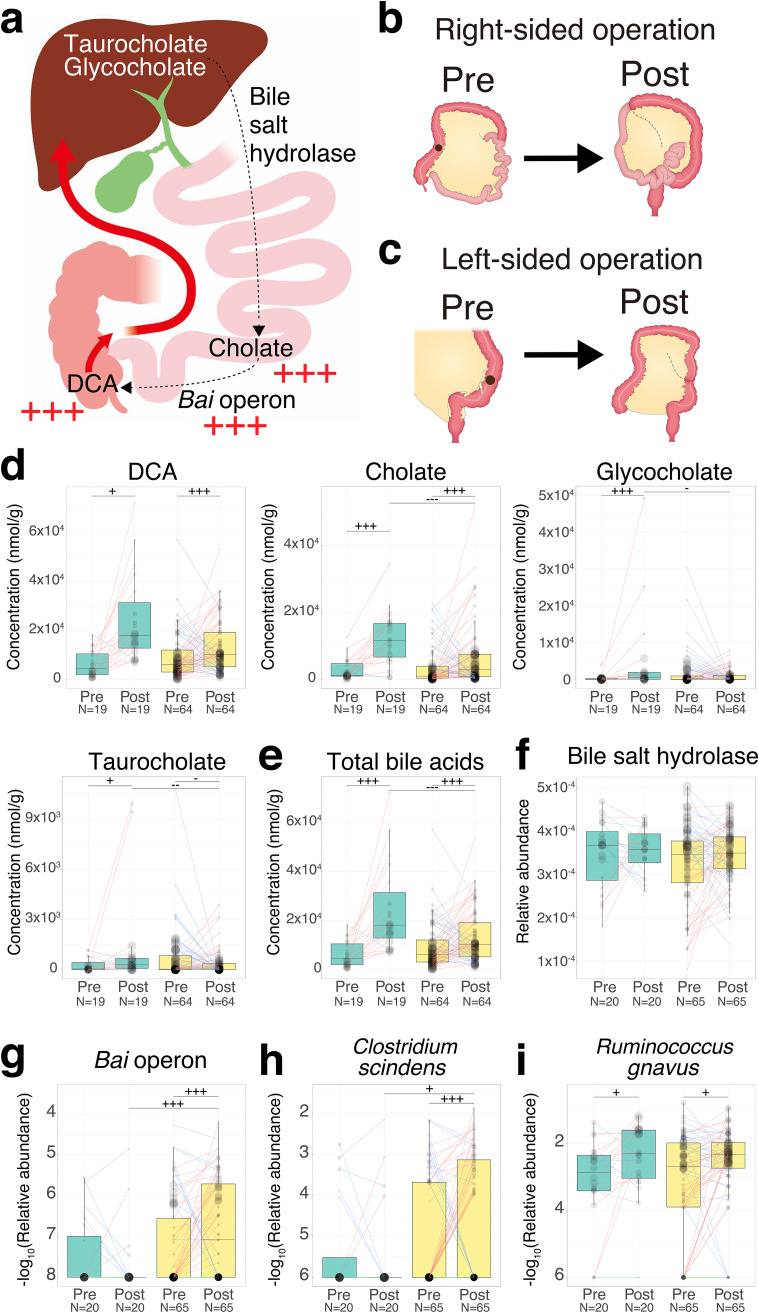
FIG 5.
Influence of right- or left-sided operations on bile acid metabolism. (a) Overview of bile acid metabolism in the gastrointestinal tract. Metabolites were placed corresponding to their production sites. The black arrow represents biotransformation by bacterial metabolism. The red arrow represents the flow of bile acid reabsorption. The red plus sign represents the increase in metabolites or operons in the postsurgical samples compared to the presurgical samples (one-sided Wilcoxon signed-rank test, P < 0.005). (b) The right-sided surgery was defined by resection of not only the right colon but also part of the terminal ileum. (c) The left-sided surgery was defined by resection of part of the left colon. The black point represents the position of CRC in panels b and c. (d to i) Each box plot shows the concentration of each metabolite (d), total bile acids (e), the relative abundance of genes (f), the −log10 transformed relative abundance of operon (g), and the −log10 transformed relative abundance of species (h and i). The sizes of the points in the box plots reflect the distribution of the population in each category. The colors of boxes in the box plot represent the right (green)- or left (yellow)-sided surgery groups, which were based on the CRC location presurgery. Each line in the box plot shows alteration patterns between pre- and postsurgical treatment groups within samples derived from the same patient (increase, red; decrease, blue; neither increase nor decrease, green). The number of samples is represented at the bottom of each category. A one-sided Wilcoxon rank-sum statistical test was performed to characterize the elevation or depletion pattern between samples from before right- and left-sided surgery or after right- and left-sided surgery. A one-sided Wilcoxon signed-rank statistical test was performed to characterize the increase or decrease trend between samples from before and after right- or left-sided surgery. Significant difference characteristics are denoted as follows: +++, elevation or increase (P < 0.005); ++, elevation or increase (P < 0.01); +, elevation or increase (P < 0.05); −−−−, depletion or decrease (P < 0.005); −−, depletion or decrease (P < 0.01); and −, depletion or decrease (P < 0.05).

