
FIGURE 3.
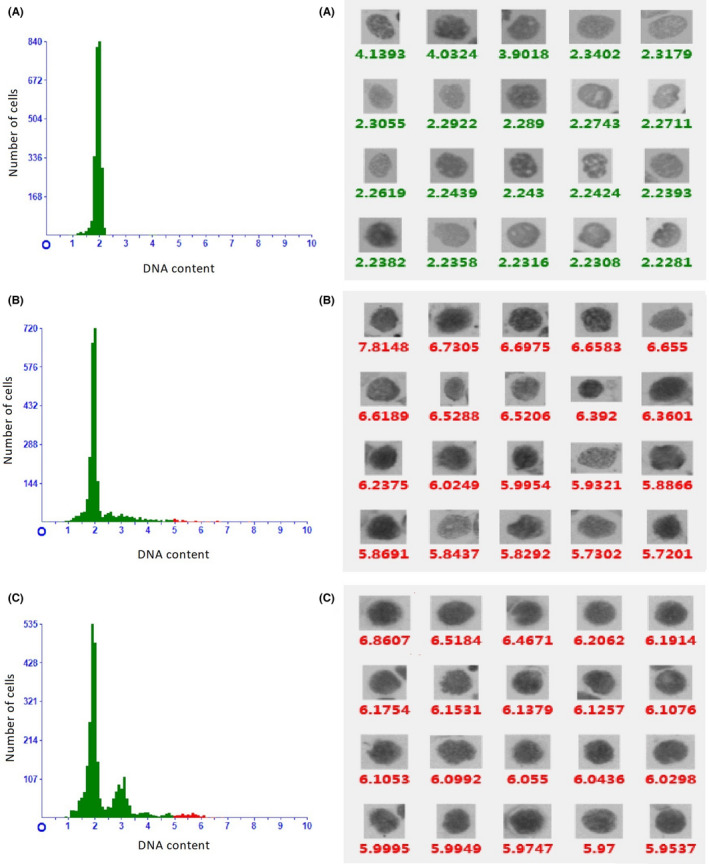
The results of automated DNA image cytometry. The left images illustrate DNA histogram, that is, DNA content (x‐axis) is plotted against number of cells (y‐axis). The right images illustrate the DNA content of every nucleus of different cells in the specimens (arranged from large to small according to DNA content). A, diploid pattern (a diploid peak on DNA histogram); B scattered aneuploid cells pattern (a diploid peak accompanied by several >5c aneuploid cells); C multiple aneuploid peaks pattern (DNA histogram revealing aneuploid DNA stemlines at 3c, 4.8c and 5.6c). The red spots represent >5c cells