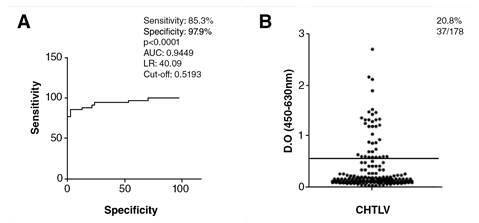
Figure 1. A. ROC curve indicating the best cut-off point, sensitivity, specificity, area under curve.

B.LISA for the detection of serum levels of IgG anti-S. stercoralis in HTLV-1 individuals

B.LISA for the detection of serum levels of IgG anti-S. stercoralis in HTLV-1 individuals