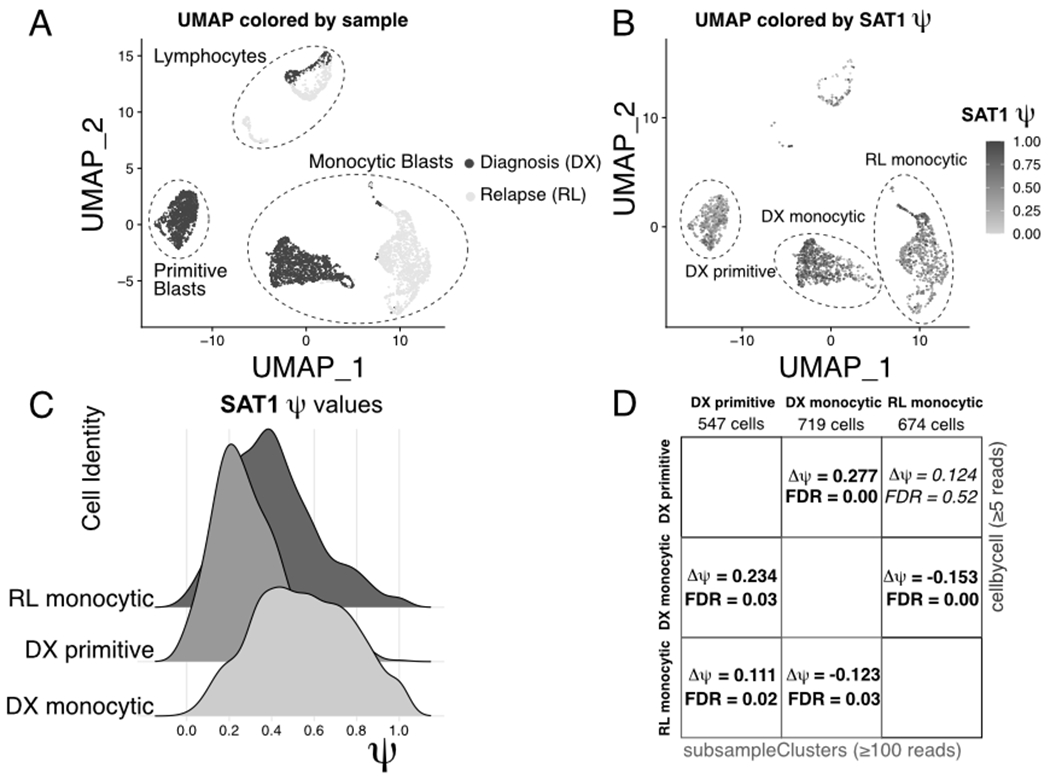
Fig. 9.

Alternative polyadenylation of SAT1 in acute myeloid leukemia. (A) UMAP projection showing the diagnosis and relapse samples from GSE143363. Major cell types are indicated with dashed circles. (B) UMAP projection from (A), with cells colored by SAT1 ψ value. Important clusters are indicated with dashed circles. (C) Ridge plot showing distributions of SAT1 ψ values in the clusters highlighted in (C). (D) Table comparing SAT1 pairwise delta-ψ tests between the clusters highlighted in (C) using “--mode subsampleClusters” and “--mode cellbycell.”
