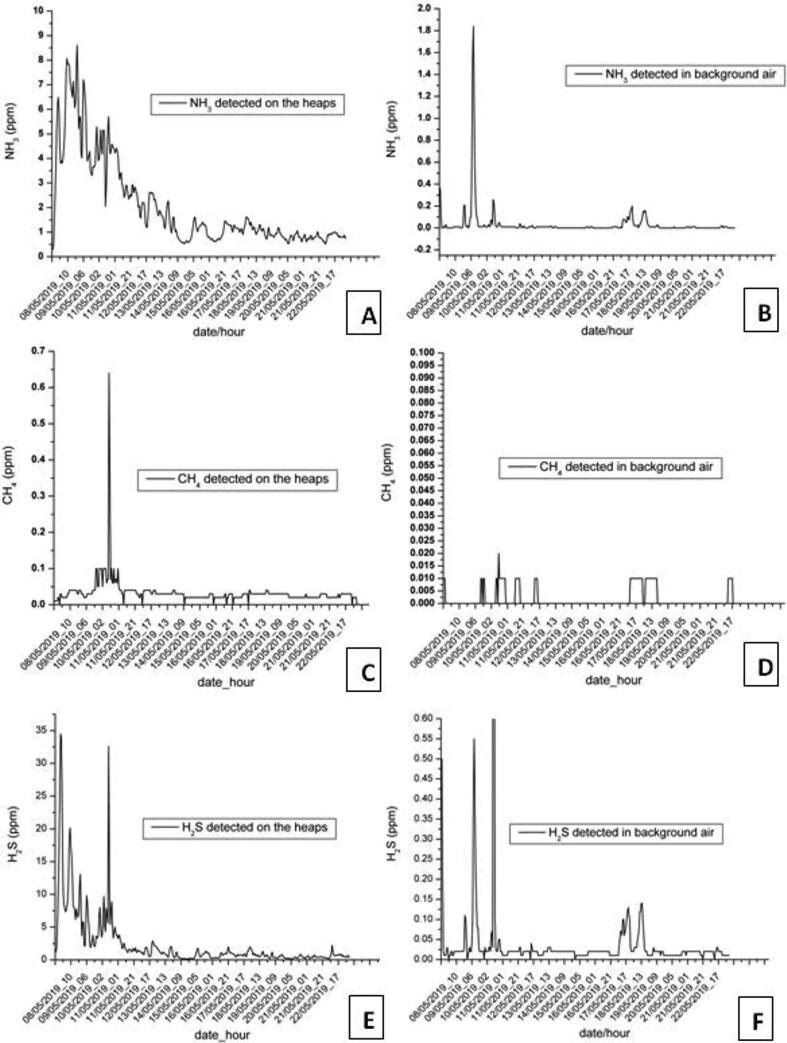
Fig. 30.
Time series of the data acquired during the POREM project. Plots are referred to the five-minute sampling rate measures and report the first weeks of the experiment, which are the most significant: (A) NH3 measured close to the manure, (B) NH3 measured in background air, (C),(D),(E),(F) are related respectively to CH4 and H2S.

