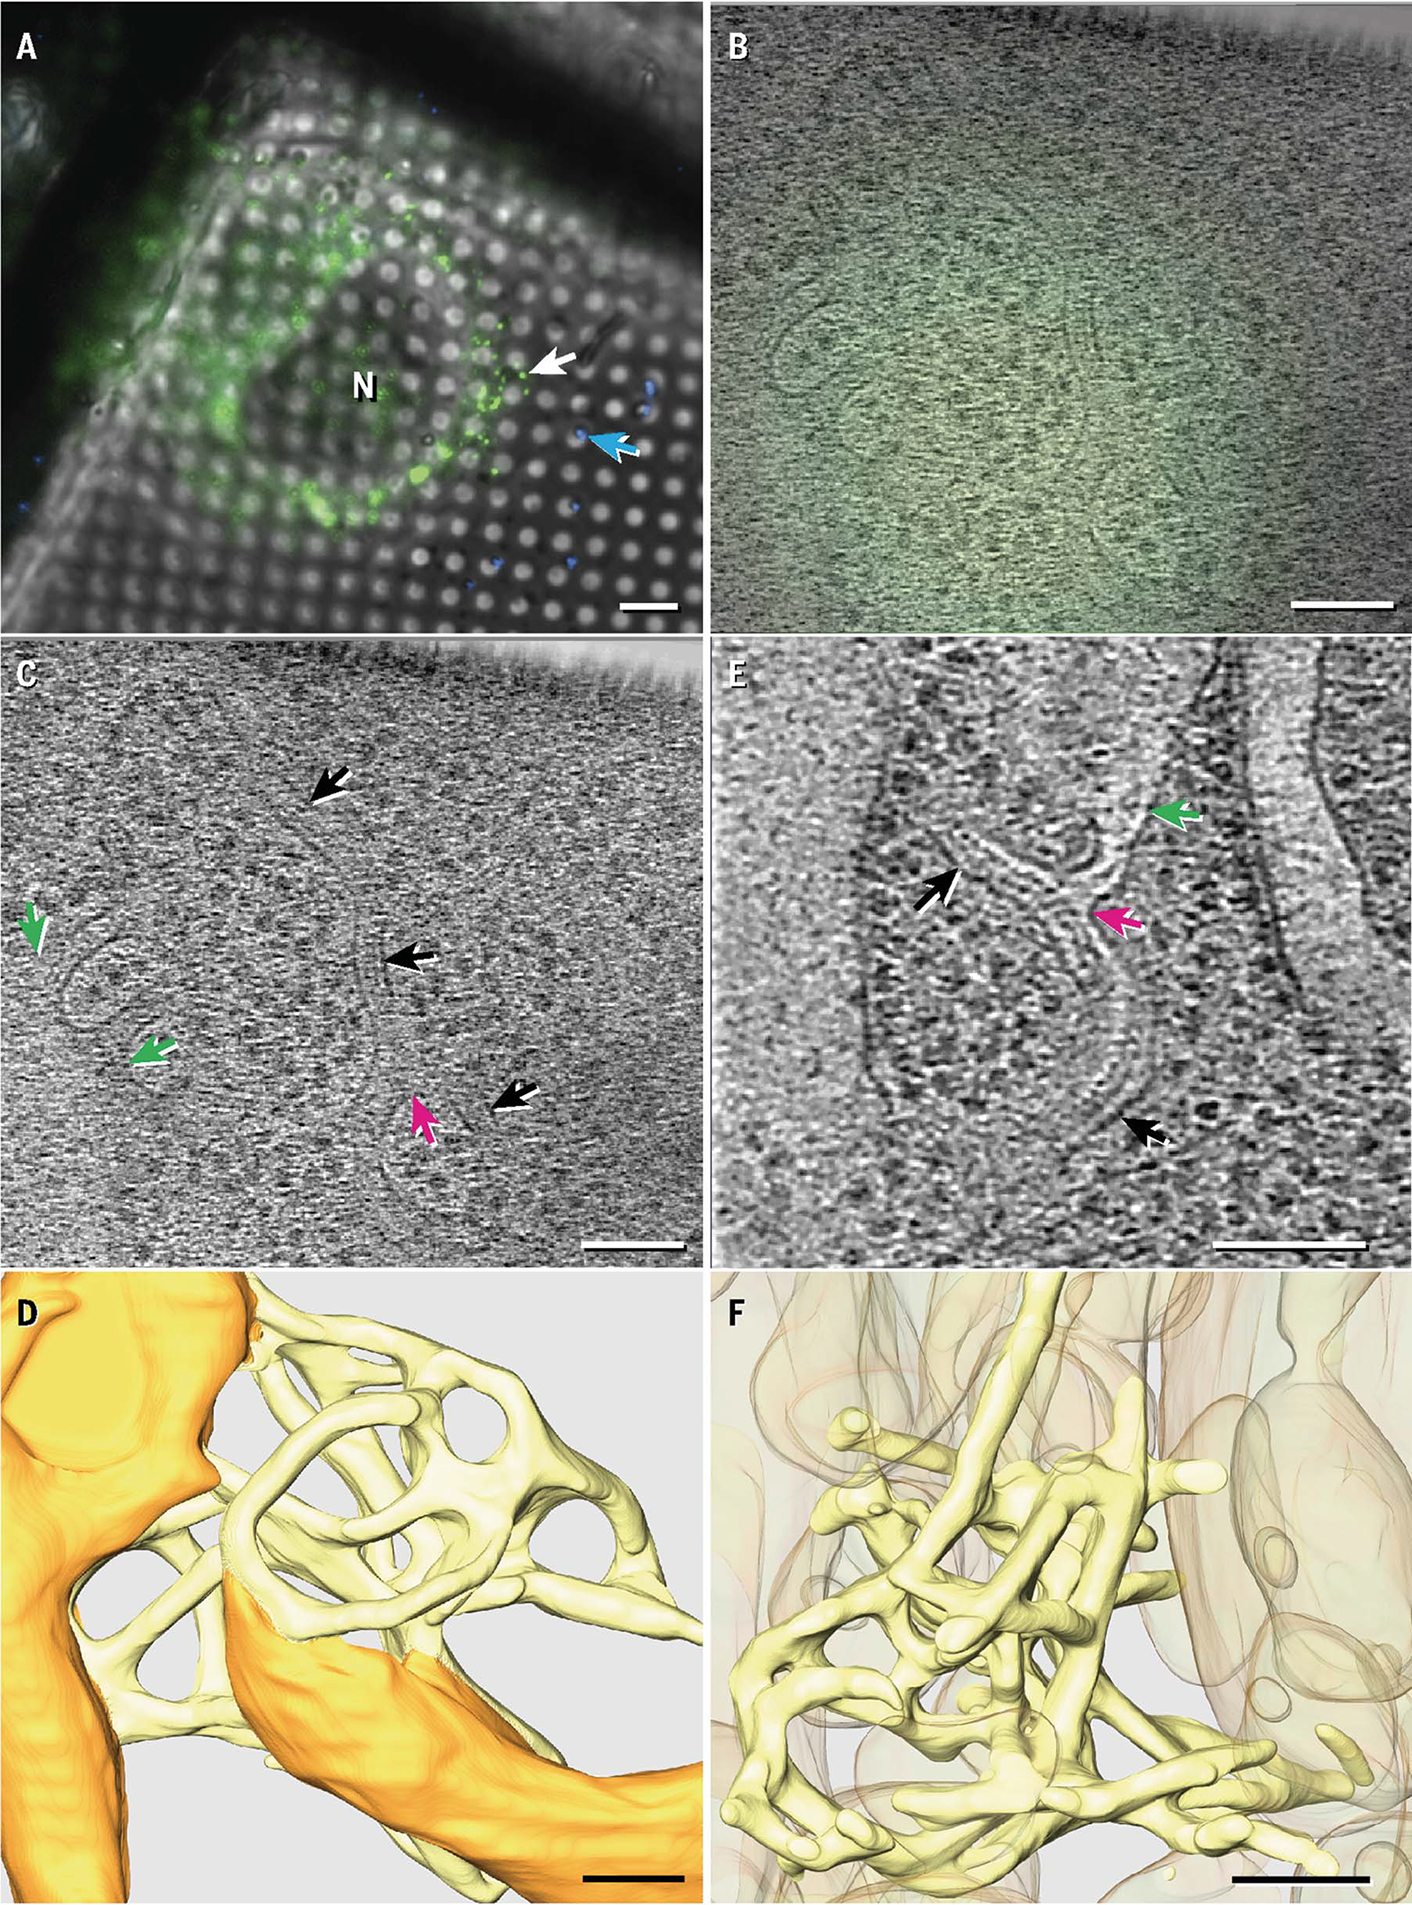
Fig. 1. IRE1α oligomers localized to specialized ER regions with complex topology.

(A) Fluorescent profiles imaged at 77 K for ER-stressed MEF-IRE1α-mNG cells grown on electron microscopy grids. The white arrow indicates the fluorescent target depicted in (B) to (D); the blue arrow indicates a 500-nm fluorescent nanosphere. N, nucleus. (B and C) Fluorescence image (B) correlated with a representative tomogram z slice (C) showing examples of narrow membrane tubes (black arrows) connected to the general ER network (green arrows) and to each other at three-way junctions (magenta arrows). (D) Manual tomogram segmentation with normal ER membranes in orange and constricted membranes colocalizing with IRE1α-mNG in yellow. (E) Representative tomogram z slice obtained in ER-stressed U2OS-IRE1α-mNG cells. Arrows are color coded the same as in (C). (F) Manual segmentation of the region shown in (E) with narrow membrane tubes in yellow and other membranes in orange at 50% transparency. Ribosomes and cytoplasmic densities in (D) and (F) are omitted for clarity and are instead shown in fig. S4. Scale bars are 6 μm for (A) and 100 nm for (B) to (F).
