
Fig. 3. IRE1α subdomain membrane tubes contained lumenal protein densities.
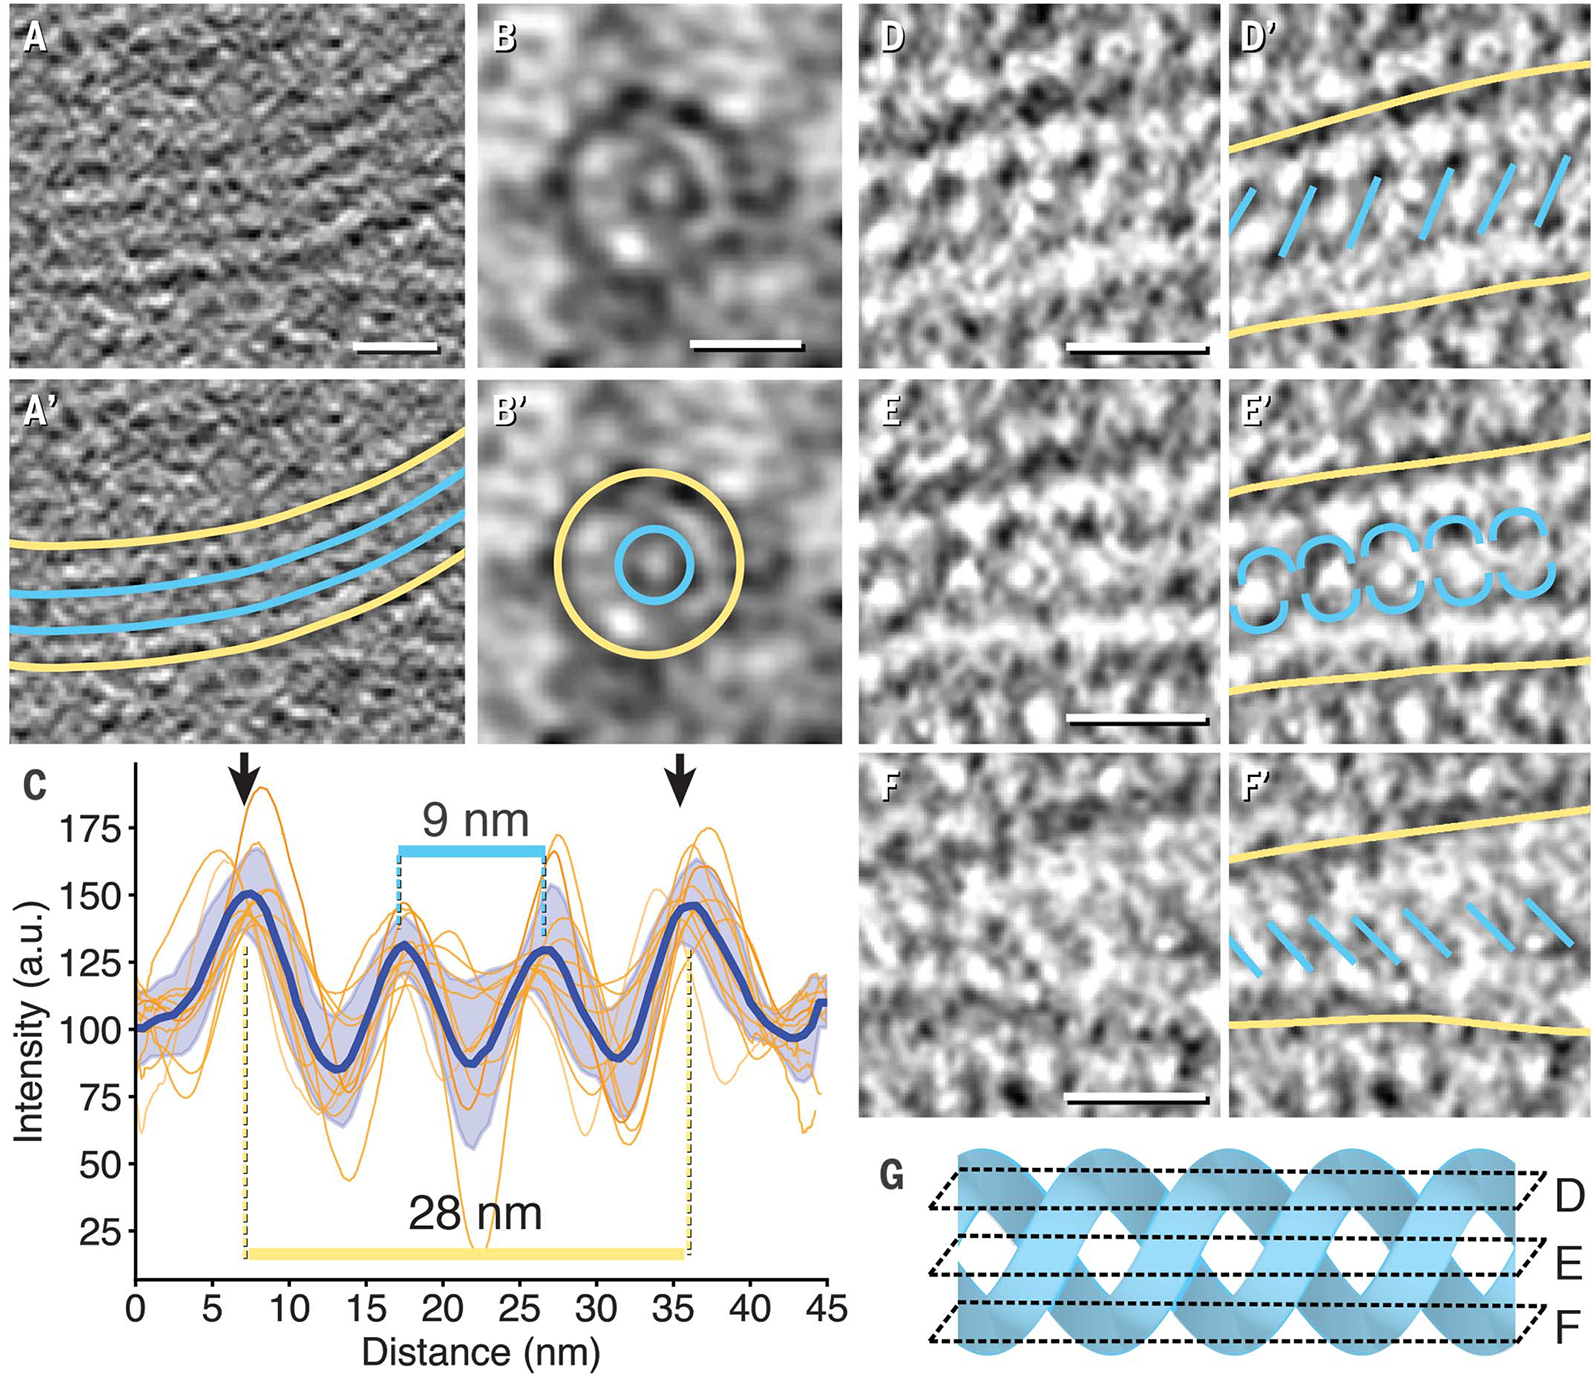
(A to C) Representative examples of longitudinal [(A) and (A′)] and end-on [(B) and (B′)] cross sections in MEF-IRE1α-mNG tomograms revealed membrane densities (yellow) surrounding lumenal protein densities (teal). Intensity line plots across subdomain tubes were aligned and averaged for nine cross sections and plotted as a function of distance in (C). The blue line with shaded error of the mean was the averaged trace for all plots. Distances separating peak maxima are indicated for membrane densities (yellow) and lumenal protein densities (teal). a.u., arbitrary units. (D to F) Example of lumenal protein densities with helical features obtained in U2OS-IRE1α-mNG cells viewed as top [(D) and (D′)], middle [(E) and (E′)], and bottom [(F) and (F′)] sections. Color coding is the same as in (A′) and (B′). (G) Idealized double helix illustrating how intercepting planes of slices in (D), (E), and (F) could yield the densities segmented in (D′), (E′), and (F′). All scale bars are 20 nm.