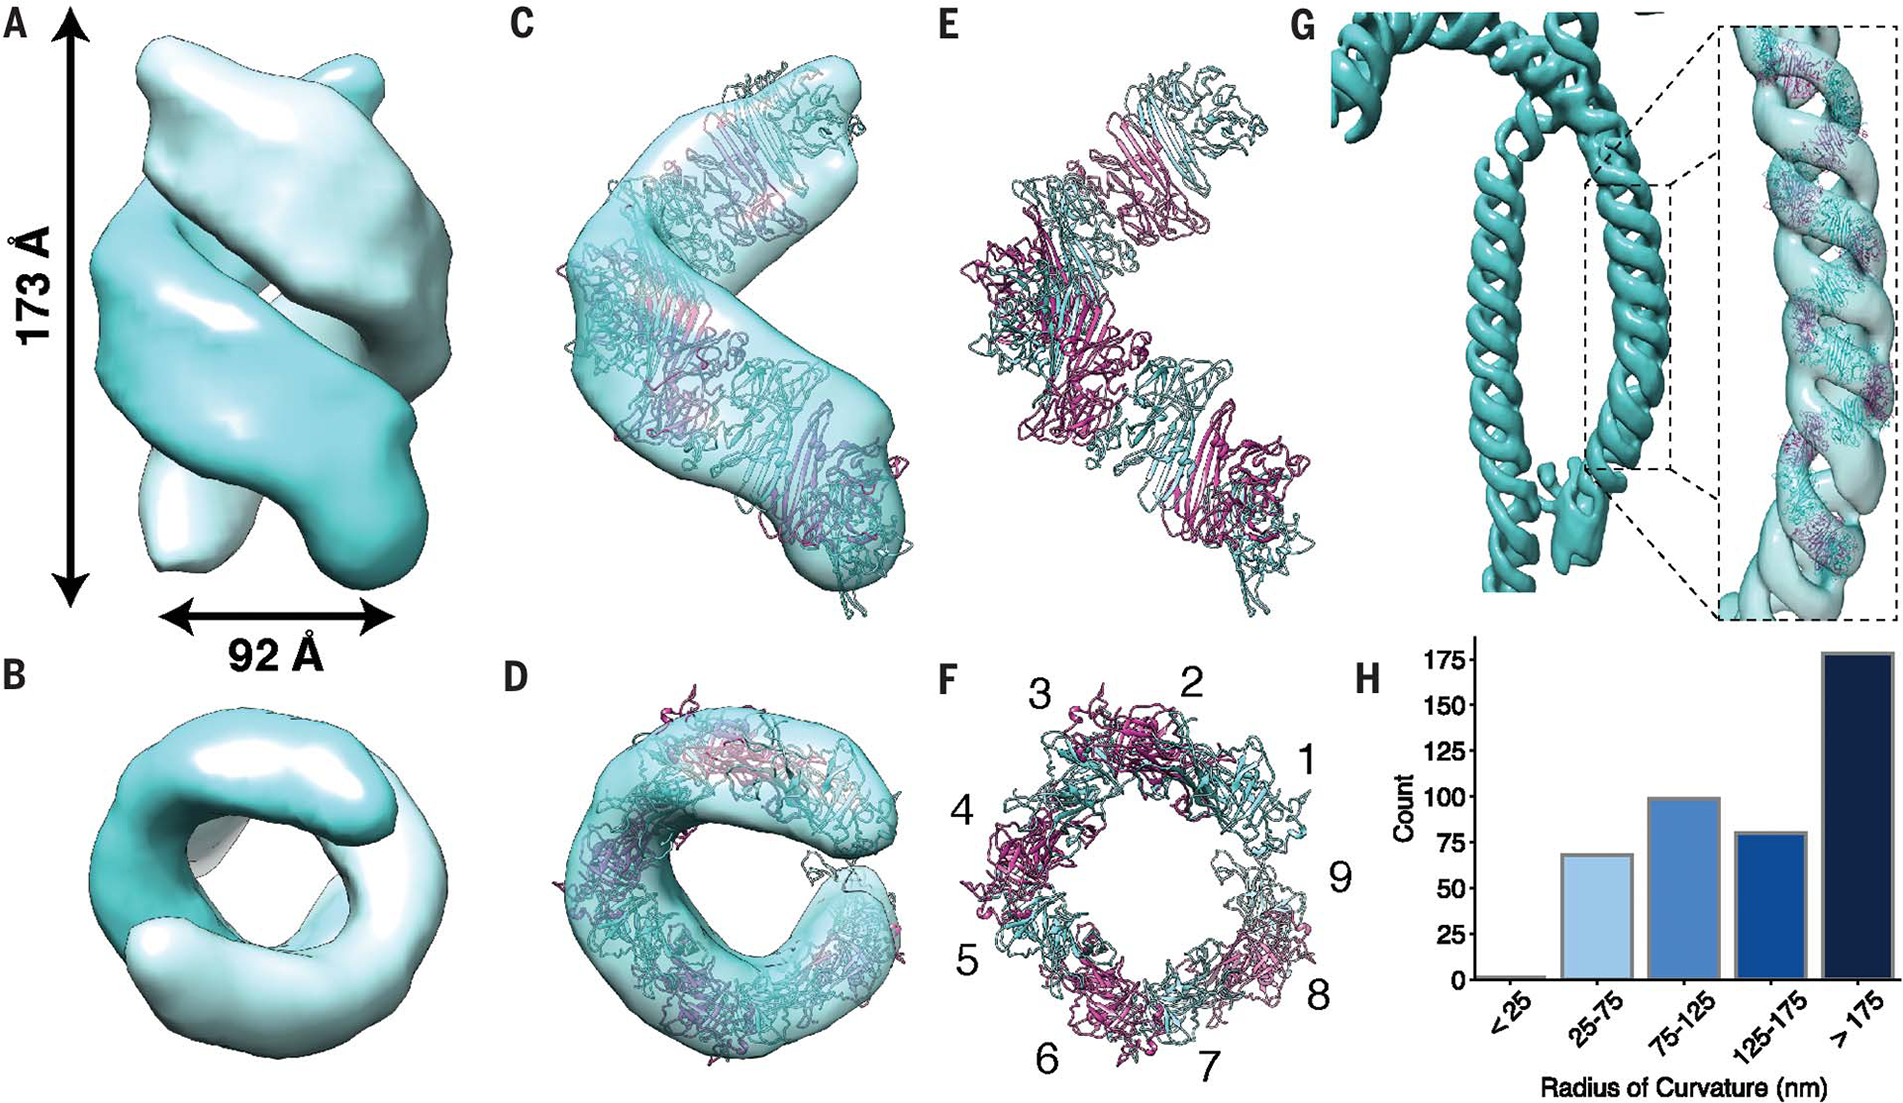
Fig. 4. Subtomogram averaging resolved flexible IRE1α-LD double helices.

(A and B) Averaged electron density map obtained from 653 subvolumes in U2OS-IRE1α-mNG tomograms with indicated helical pitch and peak-to-peak width. (C to E) Semitransparent masked single-strand map fitted with modeled IRE1α-cLD oligomer [(E) and (F)] with 84% of the atoms fitting within the map. Panels (B), (D), and (F) are 90° x-axis rotations of (A), (C), and (E), respectively. (F) Nine monomers of IRE1α-cLD complete one turn per strand. (G) Isosurface of the averaged density mapped back onto the cryo-tomogram at a highly curved region and fitted with a modeled IRE1α-cLD helix. (H) Histogram of 274 radii of curvature measured in 25-nm segments along IRE1α subdomains.
