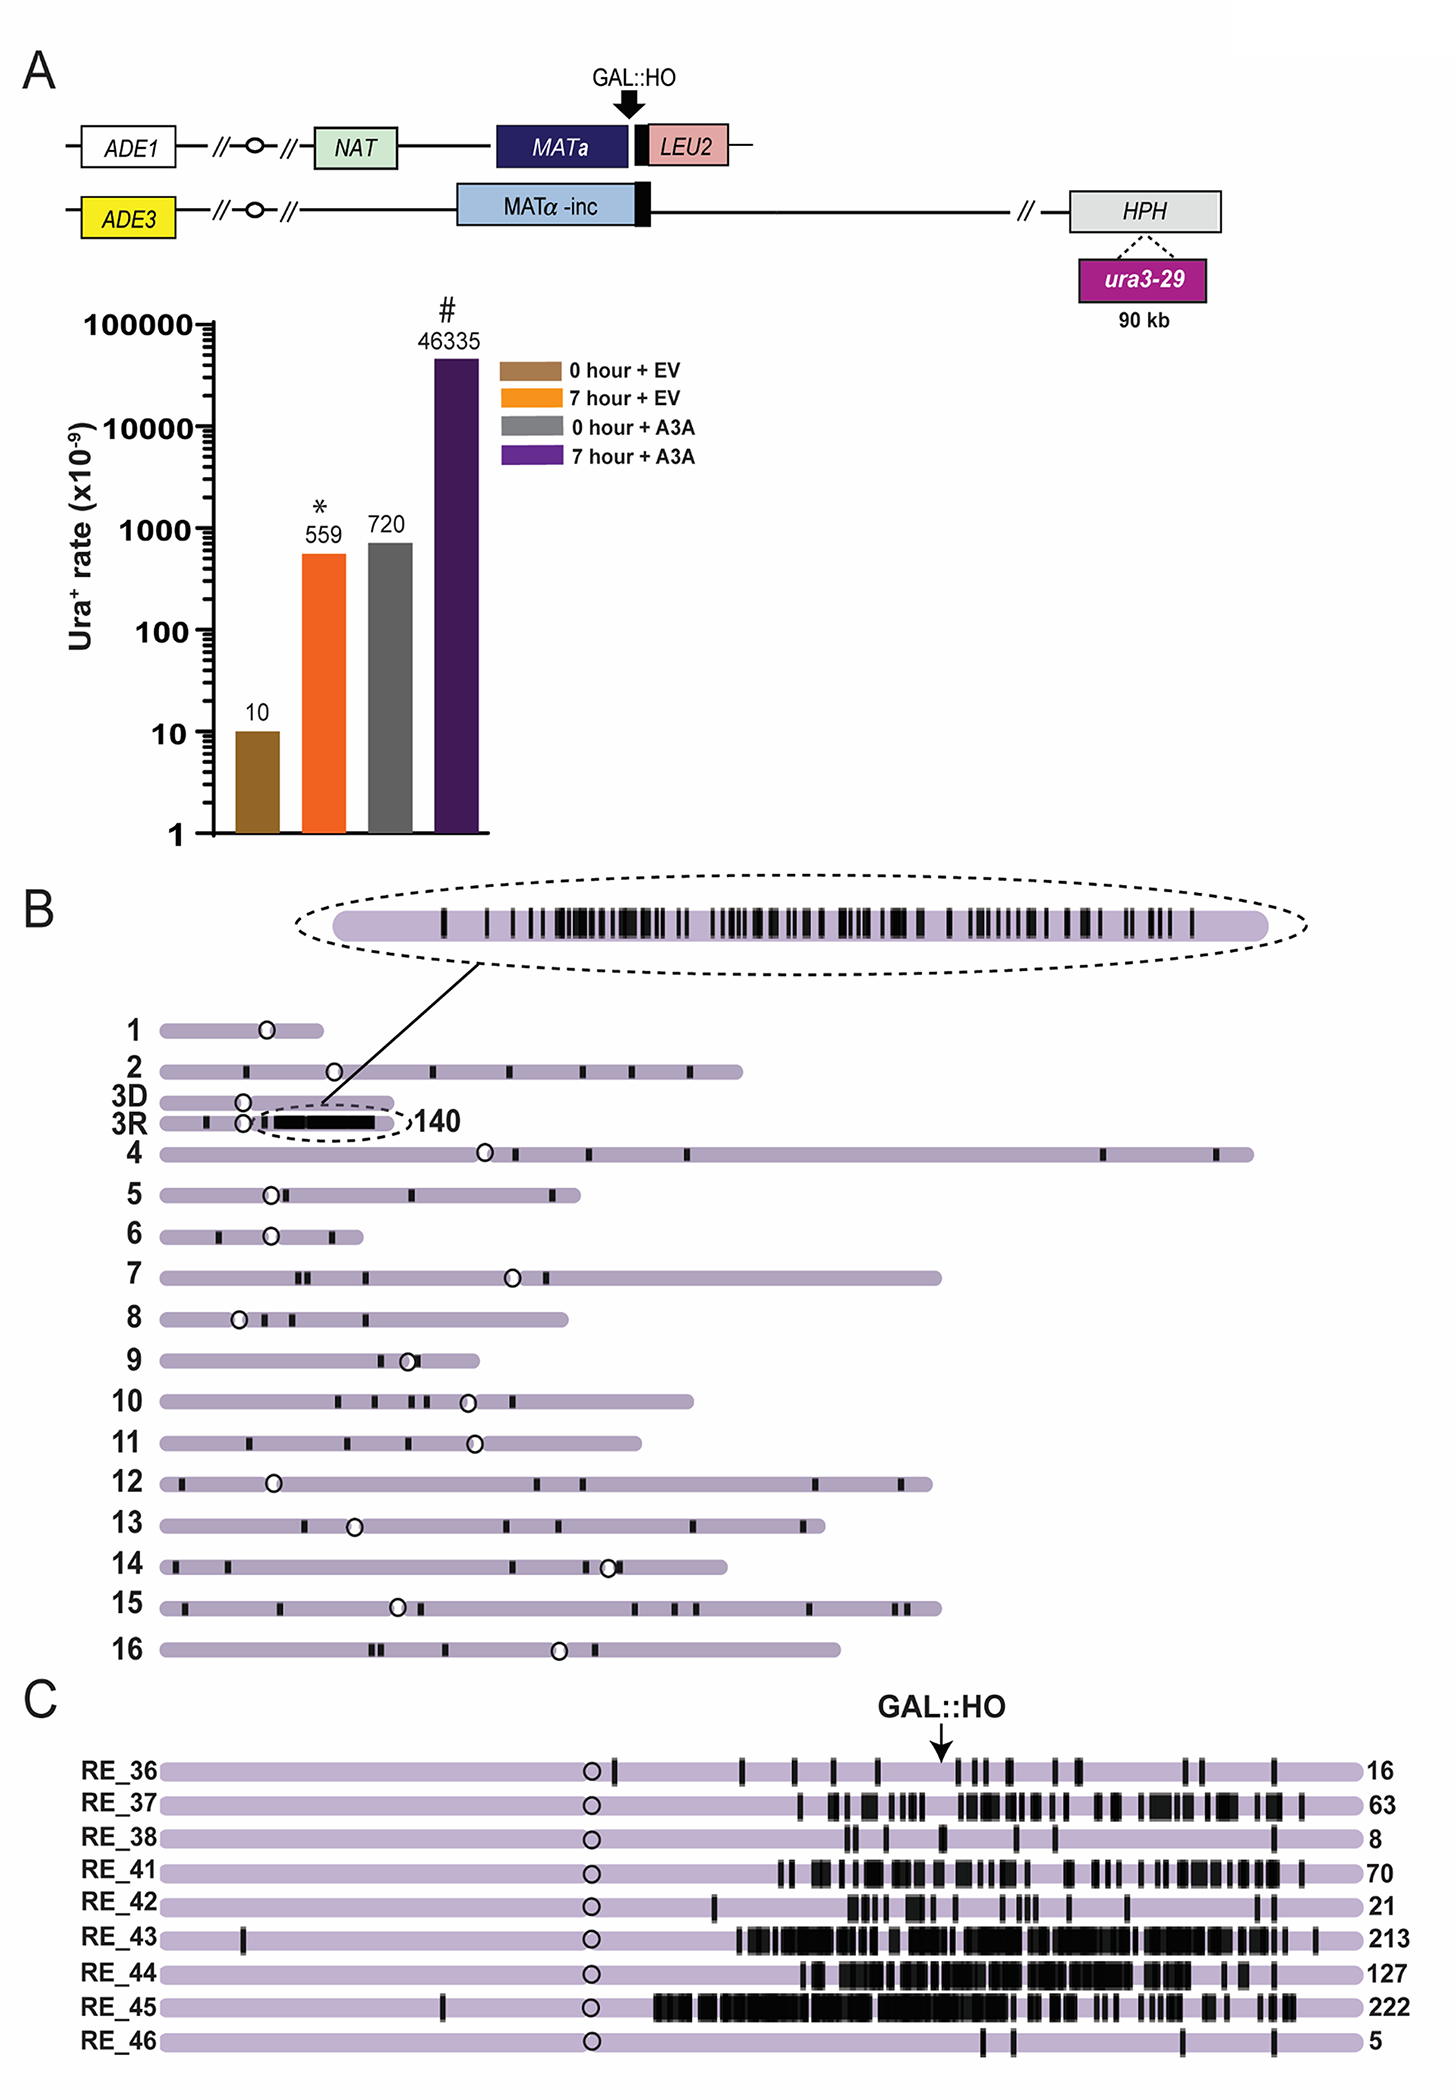
Figure 3. Mutations accumulating in ssDNA formed during BIR.

(From data in Elango et al [16] published under Oxford University Press’s open access and a Creative Commons Attribution 4.0 International License). A. The increase of Ura+ reversions resulting from BIR in the presence of expression of APOBEC3A. Top: experimental disomic system (similar to that shown in Fig. 1A, but containing ura3-29 mutation reporter inserted at position 90kb centromere distal to MATα-inc. Bottom: Ura+ rates for ura3-29 inserted at 90kb Chr. III position following BIR in the presence of APOBEC3A containing plasmid (A3A) or empty vector (EV). Asterisk and pound-symbol indicate statistically significant differences from No-DSB (0h) and from no-A3A (EV), respectively. B. A3A-induced mutations (black vertical lines) in one BIR outcome in the progeny of ung1Δ derivative of AM1003 formed in the presence of A3A. Enlarged: mutation cluster on the track of BIR C. Clustered mutations in BIR isolates formed in the presence of A3A. Positions of mutations (black lines) are depicted along the chromosome III reference. The total number of mutations in each cluster is indicated by a number (on the right).
