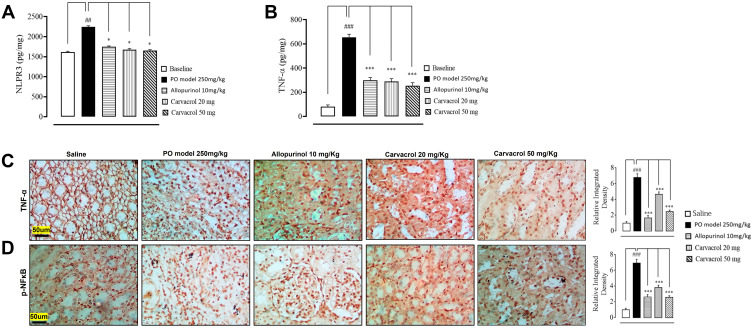
Figure 2.
Effects of carvacrol treatment on the inflammatory mediators of PO-induced hyperuricemic rats. The tissue levels of (A) NLRP3 and (B) TNF-α were quantified using ELISA (n = 7 per group). The data are presented as means ± SEM. Representative images showing the immunoreactivity of (C) TNF-α (D) p-NF-κB (n = 7 per group). Scale bar = 50 μm, 40× magnification. The data are presented as means ± SEM. ***p < 0.001 compared to the model group (PO treated), ###p < 0.001 compared to the saline group, ##p < 0.01 compared to the saline group, *p < 0.05 compared to the model group (PO treated).

