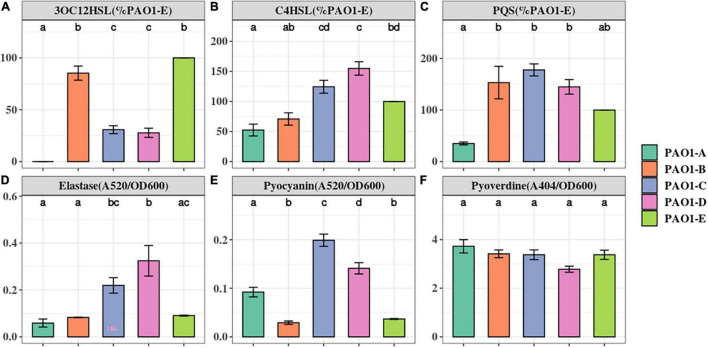
FIGURE 1.
The Quorum Sensing signals and virulence factors production in P. aeruginosa PAO1 sublines. The level of QS signals (A–C) produced were compared to that of the PAO1-E with the mean set to 100%. The level of virulence factors (D–F) were normalized by cell density (OD600). The small letter alphabets on the data points signify the statistically significant differences between the data points. Different alphabets on the data points signify significant differences between those points. More than one alphabet on one strain shows its significance across two or more groups. The individual sublines (x-axis) are denoted by the specified colors of the figure label. Data represent the mean+/− SD of three independent experiments.

