FIG. 2.
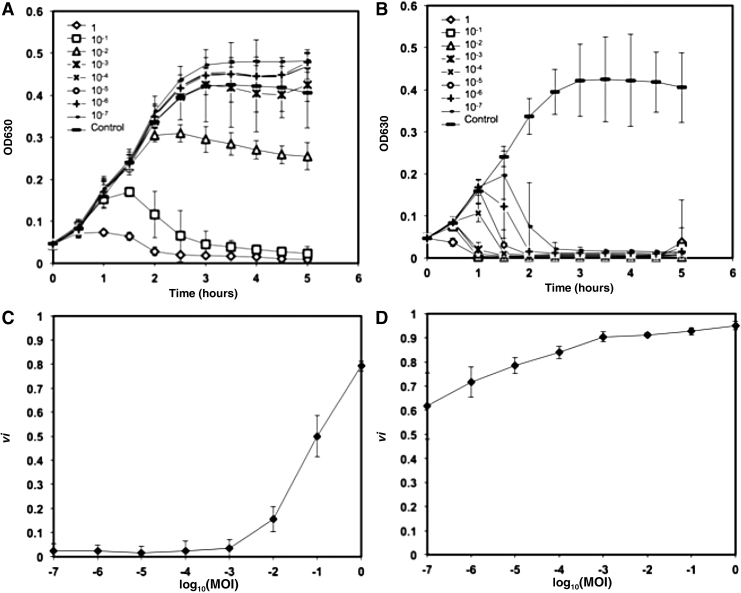
(A) Bacterial reduction curves and (B) corresponding virulence curve for phage T5 infecting E. coli ATCC 11303 in TSB at 37°C. (C) Bacterial reduction curves and (D) corresponding virulence curve for phage T7 infecting E. coli ATCC 11303 in TSB at 37°C. Error bars depict the standard deviation of six replicates.

