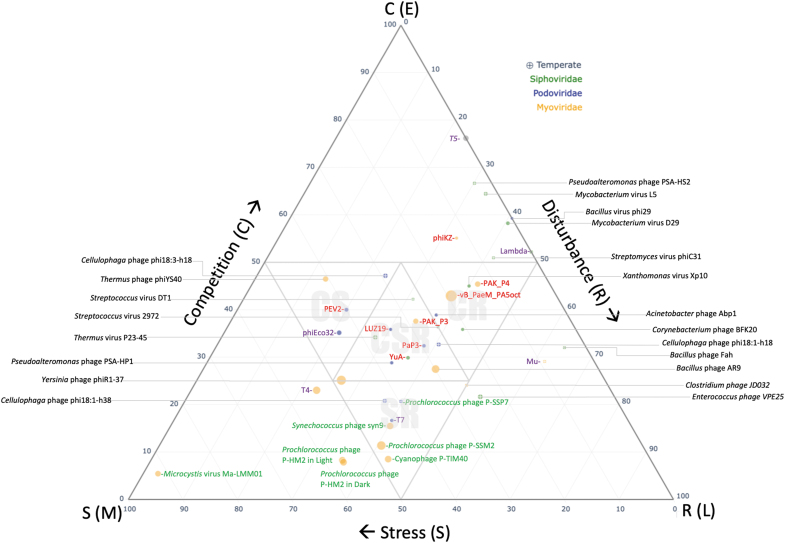
FIG. 3.
Shows the position of 42 phages based on the proportions of early, middle, and late genes within the CSR triangle, which reflects their ability to tolerate competition, stress, or disturbance. The color and size of the dots represent the phage classification into myoviruses, siphoviruses, and podoviruses and their genome size. Although the phages were all examined during their lytic cycle, those with a cross have access to the temperate cycle. Associated labels of phages that target Pseudomonas are shown in red, Escherichia in purple, and cyanobacteria in green.

