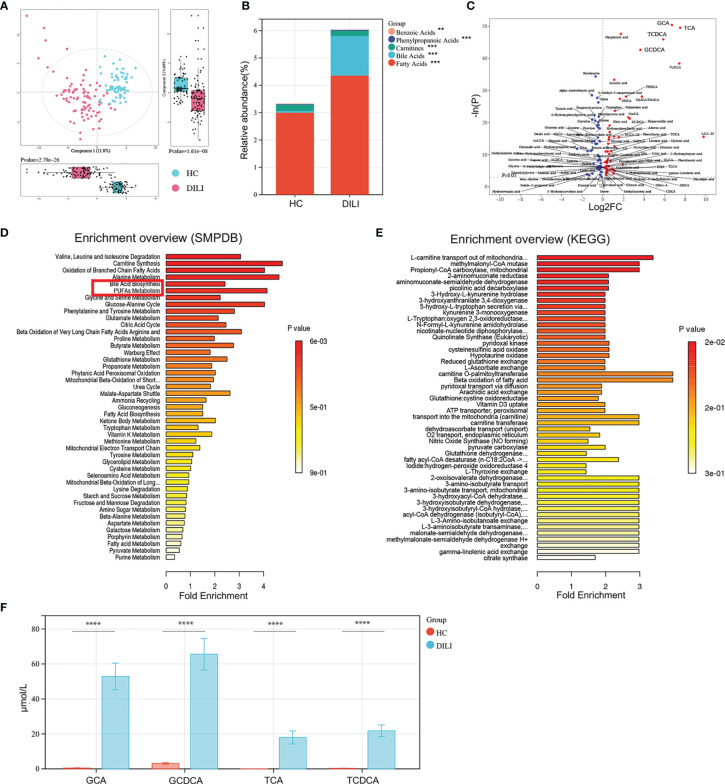
Figure 2.
Examination of the metabolic profiles of HCs and DILI patients. (A) The PCA plot showed a clear discrimination of serum metabolic profiles between DILI patients and HCs. (B) The relative abundance of mainly differential metabolite classes in HC and DILI group. (C) Volcano plot of the most significant metabolite changes comparing HCs with DILI patients. (D, E) Pathway analysis used to discover the differences of metabolic characteristics between DILI and HCs (based on KEGG or SMPDB). (F) Boxplot of the four most significant metabolites in the analysis of volcano plot comparing HCs and DILI patients. **p < 0.01; ***p < 0.001; ****p < 0.0001. PCA, principal component analysis; PUFA, polyunsaturated fatty acid; SMPDB, human metabolome database; KEGG, kyoto encyclopedia of genes and genomes; GCA, glycocholic acid; GCDCA, glycochenodeoxycholic acid; TCA, taurocholic acid; TCDCA, taurochenodeoxycholic acid.

