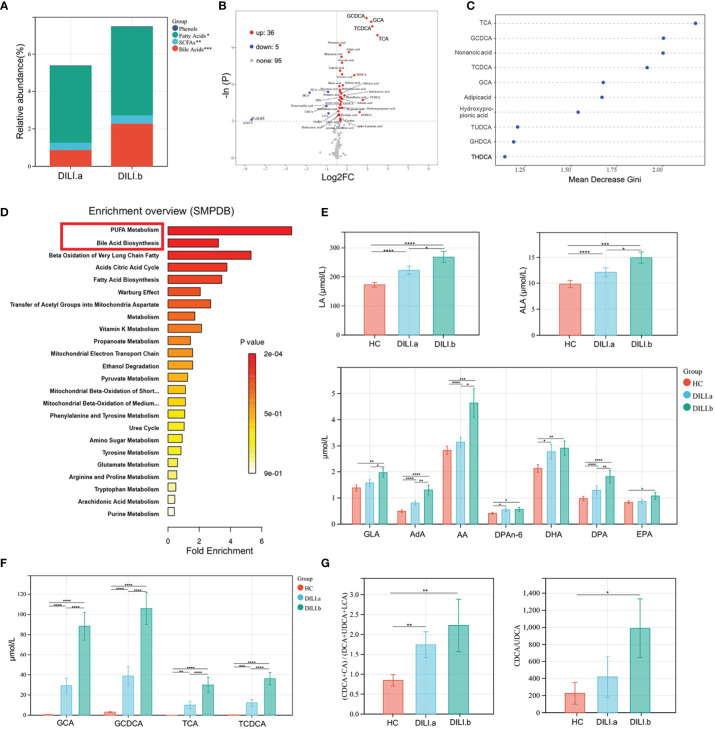
Figure 3.
Examination of the metabolic profiles of DILI with different severity. DILI patients were categorized as mild (Grade 1), moderate (Grade 2), severe (Grade 3) and liver failure (Grade 4) groups. Grade 1 and Grade 2 were defined as DILI.a group, and Grade 3 and Grade 4 were defined as DILI.b group. (A) The relative abundance of differential metabolite classes between different groups of DILI. (B) Volcano plot of the most significant metabolite changes comparing DILI.a with DILI.b group. (C) Importance scores of top 10 important differential metabolites by RF between DILI.a and DILI.b. (D) A pathway analysis used to discover the different metabolic characteristics between DILI.a and DILI.b (based on SMPDB). (E, F) Boxplot of main differential bile acid and PUFAs. (G) Ratios of (CDCA+CA)/(DCA+UDCA+LCA) and CDCA/UDCA in HC, DILI.a and DILI.b groups. *p < 0.05; **p < 0.01; ***p < 0.001; ****p < 0.0001. RF, random forest; SCFA, short chain fatty acids; ALA, α-linolenic acid; LA, linoleic acid; AA, arachidonic acid; DPA, docosapentaenoic acid; GLA, gamma-linolenic acid; AdA, adrenic acid; CDCA, chenodeoxycholic Acid; CA, cholic acid; DCA, deoxycholic acid; UDCA, ursodeoxycholic acid; LCA, lithocholic acid.

