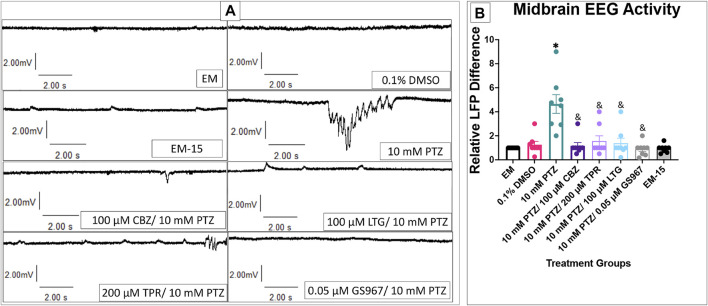
FIGURE 7.
Local field potentials in 7 dpf larvae. (A) Representative tracings recorded in the presence of EM (top) and 10 mM PTZ (bottom) are shown. (B) The relative LFP difference is displayed on the y-axis. The respective treatment groups are shown on the x-axis. Analyses (one-way ANOVA, Tukey’s post-hoc) are marked * (p < 0.05) to indicate significant differences to embryo medium (EM). Standard error of the means is shown. Analyses (one-way ANOVA, Tukey’s post-hoc) are marked & (p < 0.05) to indicate significant differences to 10 mM PTZ. (n = 8 fish/treatment group).

