Figure 4.

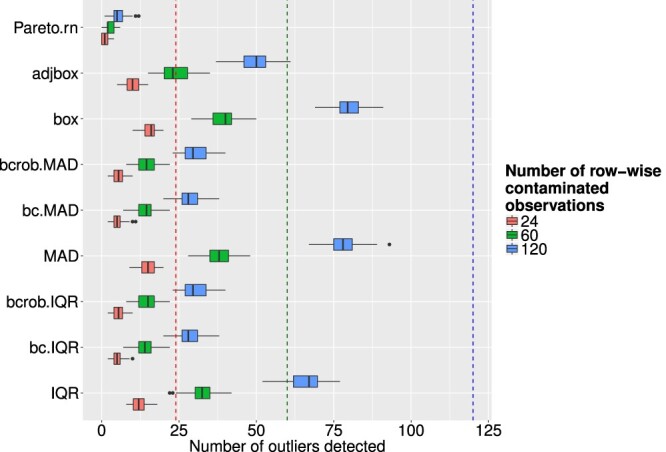
Boxplots of successfully detected artificial outliers, where the whole observation was contaminated, for different outlier detection methods and different levels of ε.

Boxplots of successfully detected artificial outliers, where the whole observation was contaminated, for different outlier detection methods and different levels of ε.