Figure 3.

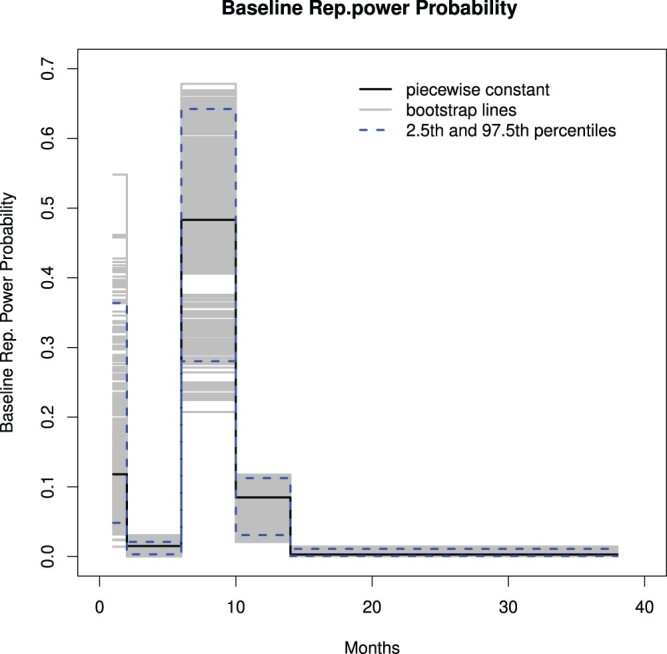
A piecewise constant function for the baseline probability function (black), 1000 bootstrap versions of this function line (gray) and the 0.25th and 0.975th percentile points (dashed) based on the bootstrap samples.

A piecewise constant function for the baseline probability function (black), 1000 bootstrap versions of this function line (gray) and the 0.25th and 0.975th percentile points (dashed) based on the bootstrap samples.