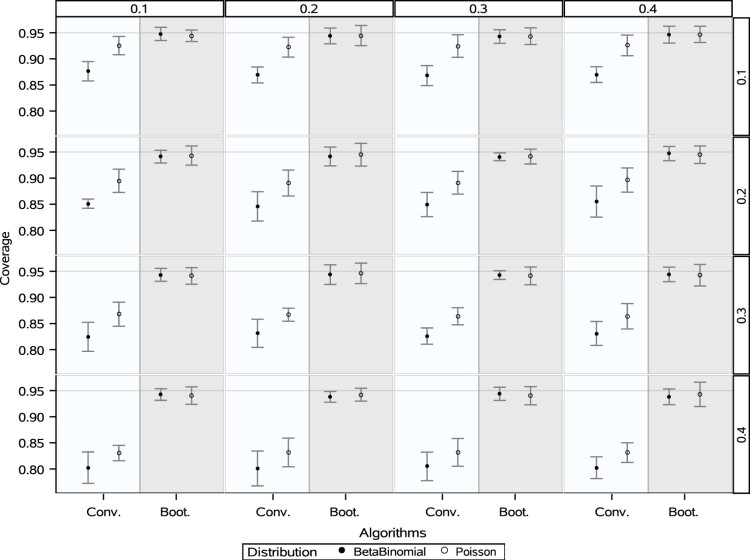
Figure 2.
The mean of confidence intervals' coverage of the conventional method and the proposed bootstrap method. The columns' heading shows the value of and the rows' heading indicates the value of . In this graph, the x-axis indicates the method used to construct the confidence intervals and the y-axis shows the coverage percentage. The error bars show the standard deviation of coverage of confidence intervals for 8 years.

