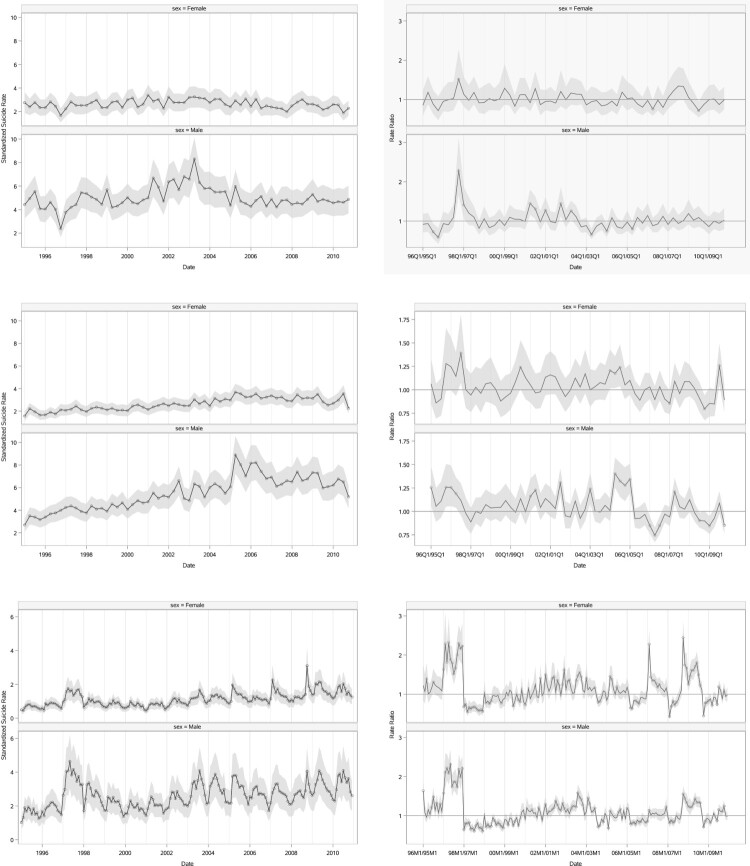
Figure 4.
The quarterly standardised suicide rates (left panels) and their corresponding ratios for two consecutive years (right panels) for Hong Kong, SAR are on the top row, and Taiwan in the middle row. The bottom row contains the monthly standardised suicide rates (left panel) and their corresponding ratios for two consecutive years (right panel) for South Korea. The light shaded band shows the 95% confidence interval.

