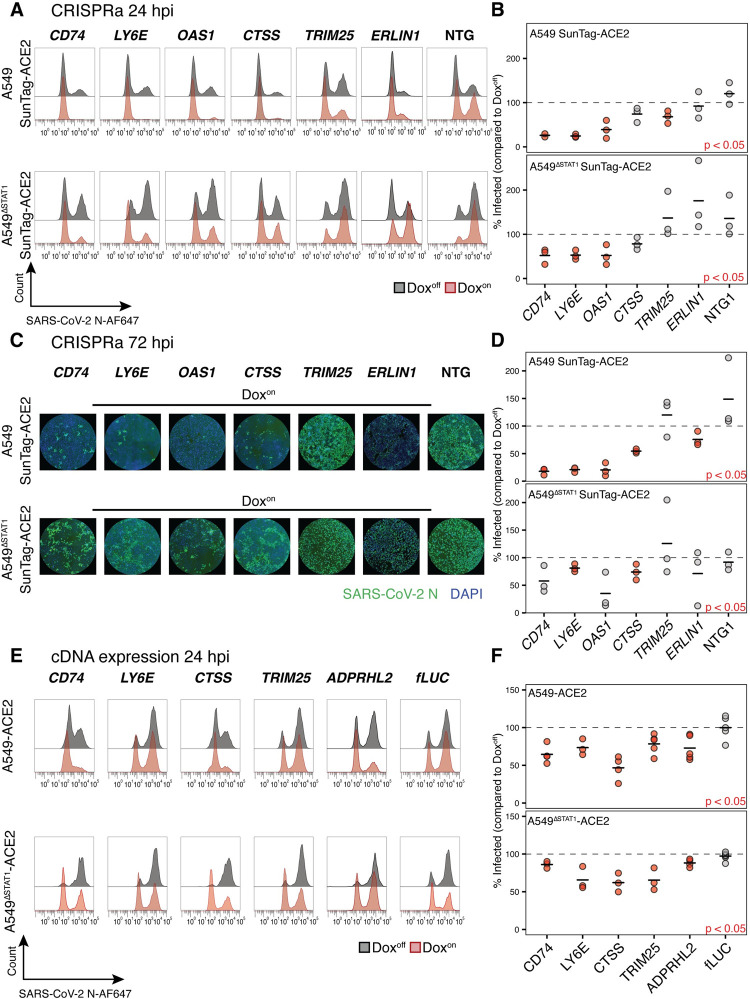
Fig 3. Validation of ISG screen hits in targeted CRISPRa and ectopic cDNA expression studies.
(A) Representative flow cytometry histograms for SARS-CoV-2 N protein in A549-SunTag ACE2 and A549ΔSTAT1-SunTag ACE2 transduced with indicated gRNAs, treated (red) or not treated (gray) with Dox, at 24 hours post-infection with SARS-CoV-2 (M.O.I. = 2). (B) Percent of infected (SARS-CoV-2 N protein positive) cells quantified across biological replicates (n = 3, n = 2 for CD74 gRNA in A549-SunTag ACE2 cells) for experiments described in (A). Values denote percent of infected cells in Doxon cultures relative to paired Doxoff cultures. Points represent individual biological replicates, black lines indicate mean values of biological replicates for each indicated ISG gRNA. Red points indicate statistical significance (p < 0.05) as determined by paired ratio Student’s t-test. (C) Representative immunofluorescence images for SARS-CoV-2 N protein and DAPI in A549-SunTag ACE2 and A549ΔSTAT1-SunTag ACE2 transduced with indicated gRNAs and treated with Dox, at 72 hours post-infection with SARS-CoV-2 (M.O.I. = 2). (D) Percent of infected (SARS-CoV-2 N protein positive) cells quantified across biological replicates (n = 3, n = 2 for ADPRHL2 gRNA in A549-SunTag ACE cells) for experiments described in (C). Values denote percent of infected cells in Doxon cultures relative to paired Doxoff cultures. Points represent individual biological replicates, black lines indicate mean values of biological replicates for each indicated ISG gRNA. Statistical significance as in (B). (E) Representative flow cytometry histograms for SARS-CoV-2 N protein in A549 ACE2 and A549ΔSTAT1 ACE2 transduced with expression constructs for indicated cDNAs (fLUC, firefly luciferase negative control), treated (red) or not treated (gray) with Dox, at 24 hours post-infection with SARS-CoV-2 (M.O.I. = 2). (F) Percent of infected (SARS-CoV-2 N protein positive) cells quantified across biological replicates (n ≥ 3) for experiments in (E). Values denote percent of infected cells in Doxon cultures relative to paired Doxoff cultures. Points represent individual biological replicates, black lines indicate mean values of biological replicates for each indicated ISG cDNA. Red points indicate statistical significance (p < 0.05) as determined by paired ratio Student’s t-test.

