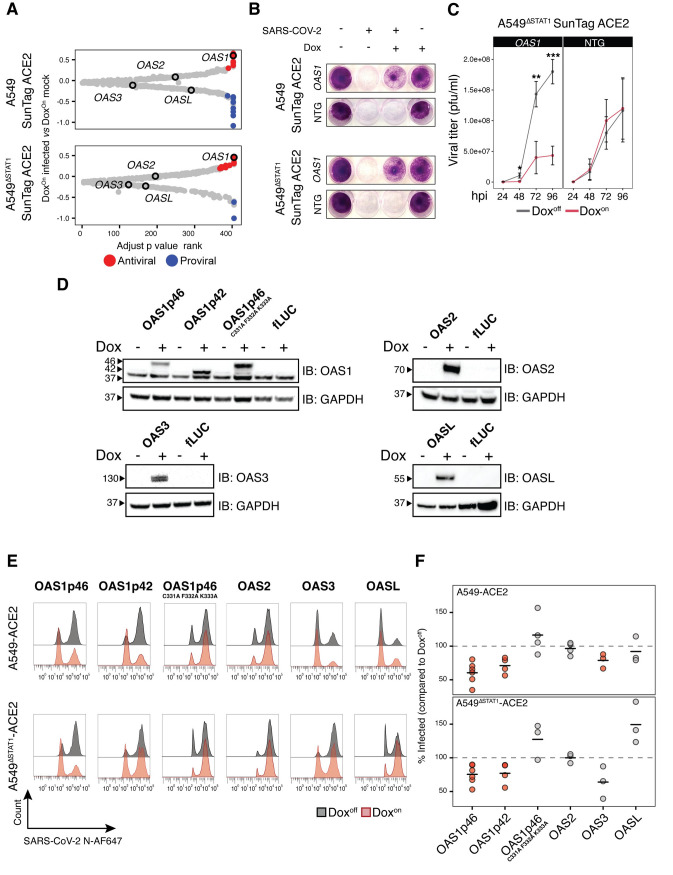
Fig 4. OAS1 is a potent SARS-CoV-2 restriction factor.
(A) OAS family genes in inducible CRISPRa ISG screen results. For A549-SunTag ACE2 and A549ΔSTAT1-SunTag ACE2 screens, ISGs were ranked by SARS-CoV-2:Dox interaction adjusted p value (x axis). β scores for SARS-CoV-2 infection status coefficient (DoxOn SARS-CoV-2 infected vs DoxOn mock infected) are plotted on the y axis, with points passing significance filters highlighted in red/blue for “antiviral”/“proviral” effects, respectively. OAS family members are labeled as indicated. (B) Images of A549-SunTag ACE2 and A549ΔSTAT1-SunTag ACE2 cultures transduced with OAS1 gRNA or NTG, treated/not treated with Dox and infected as indicated with SARS-CoV-2 (M.O.I. = 2, 72 hours infection). Cultures were fixed and stained with Crystal violet to visualize cell viability. (C) SARS-CoV-2 growth curves measured by plaque assay. A549ΔSTAT1-SunTag ACE2 cells expressing OAS1 gRNA or NTG gRNA were infected with SARS-CoV-2 (M.O.I. = 0.1) and culture media was collected at indicated time points (x-axis, hours post infection, hpi). Titer was determined by plaque assay on Vero-E6 cells. Statistical significance at each timepoint determined by two-sided Student’s t-test, *** p < 0.0005, ** p < 0.005, * p < 0.05. (D) Immunoblot analysis of OAS1 isoforms, OAS1p46 catalytic inactive mutant, OAS2, OAS3 and OASL. Indicated genes were expressed from lentivirus vectors and gene expression was induced by Dox treatment for 48 hours prior to immunoblotting with indicated antibodies. fLUC-expressing vector was used as a negative control. (E) Representative flow cytometry histograms for SARS-CoV-2 N protein in A549 ACE2 and A549ΔSTAT1 ACE2 transduced with expression constructs for indicated OAS family member cDNAs, treated (red) or not treated (gray) with Dox, at 24 hours post-infection with SARS-CoV-2 (M.O.I. = 2). (F) Percent of infected (SARS-CoV-2 N protein positive) cells quantified across biological replicates for experiments described in (E). Values denote percent of infected cells in Doxon cultures relative to paired Doxoff cultures. Points represent individual biological replicates, black lines indicate mean values of biological replicates for each indicated cDNA. Red points indicate statistical significance (p < 0.05) as determined by paired ratio Student’s t-test.

