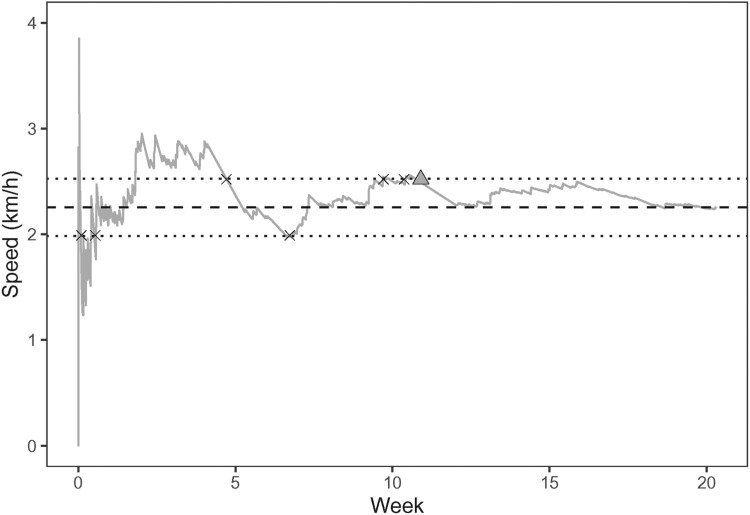
Figure 1.
Estimate of the average velocity (gray curve) of an individual in the MDC data over weeks. The dashed line indicates the value of , and the two dotted lines represent the lower bound and the upper bound for . These bounds correspond with times τ for which the APE . The crosses denote the times τ for which . The last crossing time for is marked with a triangle and occurs at the end of week 10.

