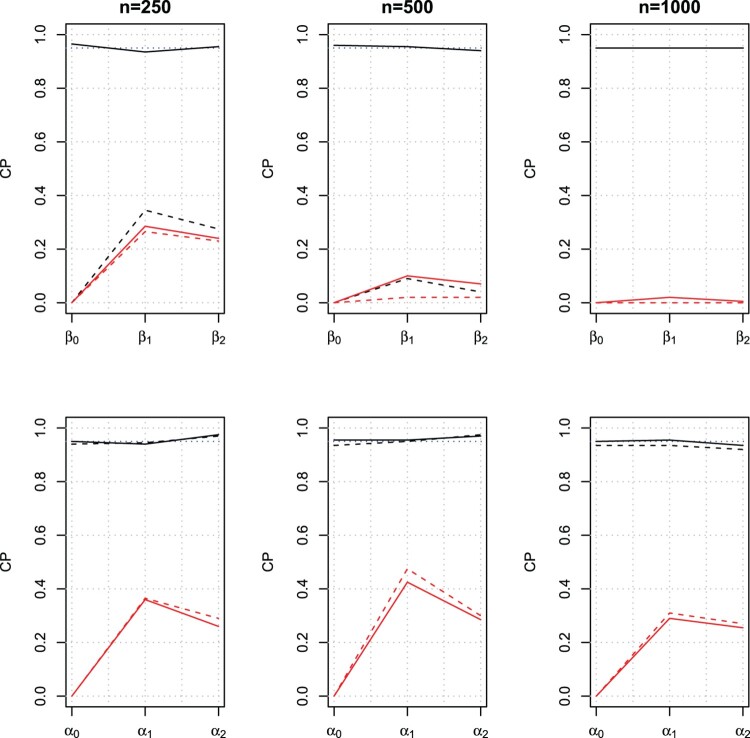
Figure 6.
Coverage probabilities of the confidence intervals of the estimated regression coefficients for the binomial process for modeling the probability of excess zeros (top panels) and the Poisson process (bottom panels) over 200 simulated datasets from model ZI-W of sample size n = 250, 500 and 1000. The black solid and dashed lines are for the models ZI-W and ZI-W , respectively; the red solid and dashed lines are for the models ZI-O and ZI-O , respectively.

