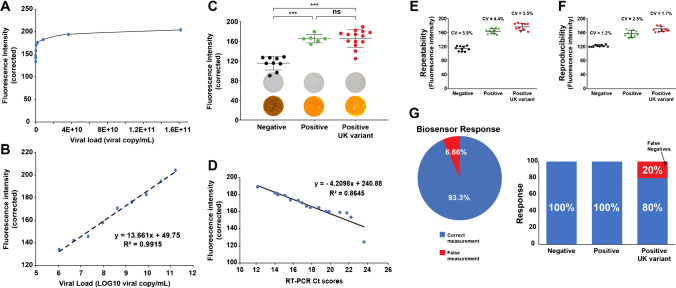
Fig. 4.
Analytical performance of the proposed PPy-g-PCL-based dot-blot assay for detecting SARS-CoV-2. Calibration analysis of the proposed fluorescent biosensor expressed in A viral load (viral copy mL−1) and B LOG10 viral load. The fluorescence was induced using a lamp (350–390 nm). C Corrected fluorescence intensities measured for the different nasopharyngeal samples and representative visual and fluorescent observations of the spots (insets). D Correlation of the PPy-g-PCL-based dot-blot sensor’s data with the RT-PCR Ct scores. E, F Repeatability and reproducibility of the assay and G the response performance of the biosensor (overall or by subgroups). CV is the coefficient of variation between the repetitive measurements expressed in percentages. ***p < 0.001 vs. negative group. ns, non-significant

