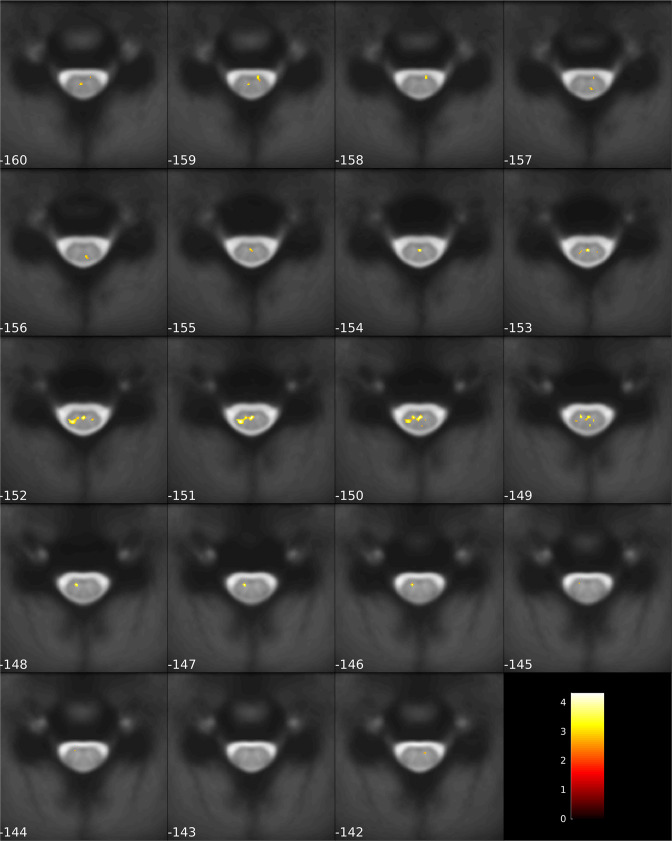
Figure 3. Spinal regions responding to remifentanil treatment.
Spinal regions that show a significant reduction in activity during remifentanil treatment comprise the left dorsal horn (DH) and layer X (LX). Parameter estimates show that spinal activity in the DH is reduced during remifentanil treatment compared to saline. Region of interest (ROI)-masked statistical t-maps are overlaid on an average mean echo planar imaging (EPI) image in PAM50 template space and the visualization threshold is set to pcorr<0.05, which is indicated as a dashed line in the color bar. The dashed circle indicates the cluster from which peak voxel parameter estimates are plotted. Error bars represent standard error of the mean.


