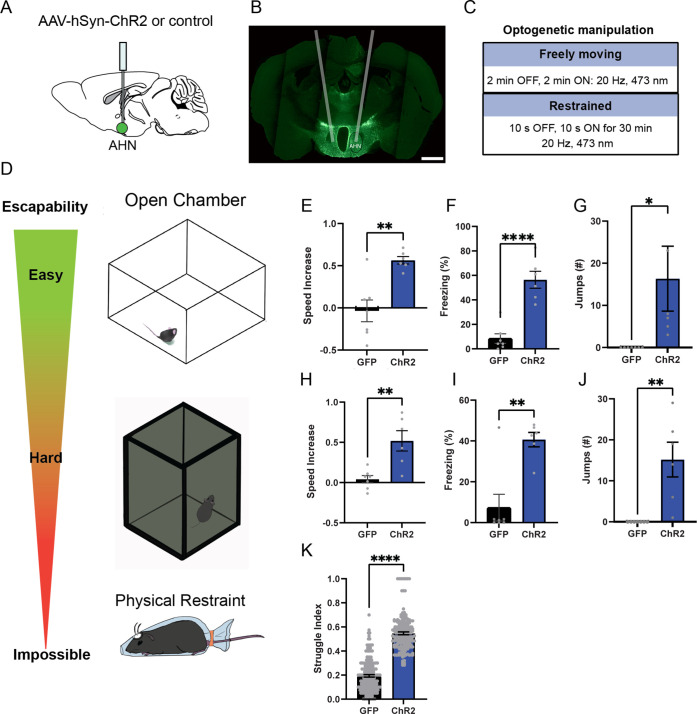
Figure 1. AHN stimulation induces escape-associated behaviors.
(a) Schematic illustration of optogenetic activation in the AHN (green circle depicts the AAV infusion). (b) An example of histological confirmation showing the expression of ChR2 and placement of optic fiber in the AHN. (c) Schematic describing optogenetic stimulation paradigm. (d) Three different escape conditions where the effects of AHN stimulation was examined. Top: open field arena with short transparent walls (condition 1, easy). Middle: tall opaque walls (condition 2, hard). Bottom: physical restraint tube (condition 3, impossible). (e) Condition 1: speed increase from the light OFF epoch to ON epoch (GFP N=7, ChR2 N=6 unpaired t-test, two-tailed, t=4.119, df=11, **p=0.0017). (f) Condition 1: freezing time during the light ON epoch (GFP N=7, ChR2 N=6, unpaired t-test, two-tailed, t=6.695, df=11, ****p<0.0001). (g) Condition 1: number of jumps during the light ON epoch (unpaired t-test, two-tailed, t=2.308, df=11, *p=0.0414). (h) Condition 2: speed increase from the light OFF epoch to ON epoch (GFP N=7, ChR2 N=6, unpaired t-test, two-tailed, t=3.778, df=11, **p=0.0031). (i) Condition 2: freezing time during the light ON epoch (GFP N=7, ChR2 N=6, unpaired t-test, two-tailed, t=4.259, df=11, **p=0.0013). (j) Condition 2: number of jumps during the light ON epoch (GFP N=7, ChR2 N=6, unpaired t-test, two-tailed, t=3.796, df=11, **p=0.003). (k) Condition 3: struggle movement during the 30 min of physical restraint (GFP N=4, ChR2 N=6, unpaired t-test, two-tailed, t=26.05, df=366, ****p<0.0001). All results reported are mean ± s.e.m. *p < 0.05, **p < 0.01, ***p < 0.001, ****p<0.0001. Scale bar=1 mm.


