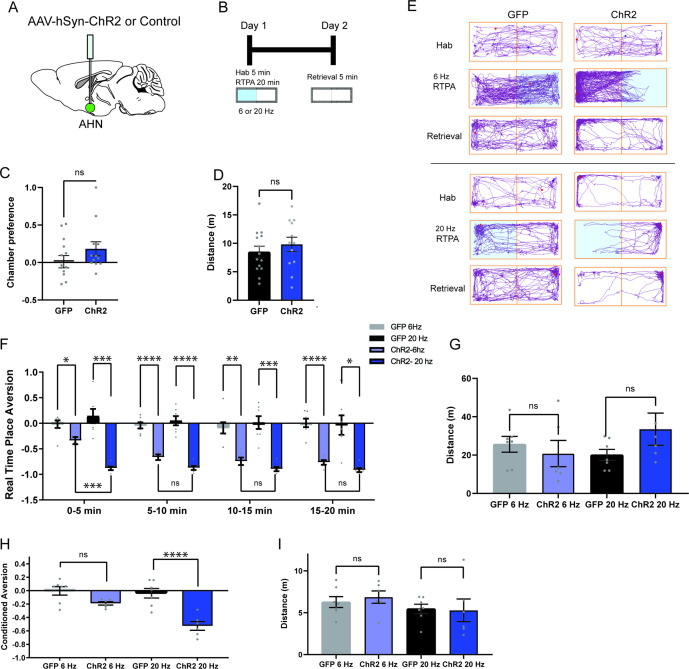
Figure 2. AHN stimulation is aversive and induces conditioned place aversion.
(a) Schematic illustration of optogenetic activation in the AHN (green circle depicts the AAV infusion). (b) Schematic describing the RTPA and CPA test paradigm: day 1 consisting of habituation and real-time place preference (20 min) and day 2 for testing conditioned place preference (5 min). (c) Chamber preference during habituation (GFP N=14, ChR2 N=12, unpaired t-test, t=1.390, df=24, p=0.1772, NS). (d) Distance travelled during habituation (GFP N=14, ChR2 N=12, unpaired t-test, t=0.8396, df=24, p=0.41, NS). (e) Representative locomotion trajectory for a GFP control animal (left column) and a ChR2-expressing animal (right column) during habituation (hab), 6 Hz or 20 Hz real-time stimulation (6 Hz RTPA, 20 Hz RTPA), and conditioned place aversion test (Retrieval). Light-coupled chambers are shown in blue. (f) Realtime place aversion monitored across 20-min test (GFP N=7, ChR2 N=6). GFP 6 Hz vs. ChR2 6 Hz (two-way RM ANOVA, time x treatment, F(3,33)=3.965, *p=0.016, time effect, F(2.252, 24.77)=4.739, p=0.152, NS, treatment effect, F(1, 11)=77.41, ****p<0.0001, Sidak’s multiple comparisons test, 0-5 min, *p=0.0359, 5-10 min, ****p<0.0001, 10-15 min, **p=0.0022, 15-20 min, ****p<0.0001). GFP 20 Hz vs. ChR2 20 Hz (two-way RM ANOVA, time x treatment, F(3,33)=0.6059, p=0.6158, NS, time effect, F(1.938, 21.32)=1.305, p=0.2911, NS, treatment effect, F(1,11)=43.38, ****p<0.0001, 24 multiple comparisons test, 0-5 min, ***p=0.0008, 5-10 min, ****p<0.0001, 10-15 min, ***p=0.0007, 15-20 min, *p=0.0127). GFP 6 Hz vs. GFP 20 Hz (two-way RM ANOVA, time x frequency, F(2.071, 12.42)=1.076, p=0.3730, NS, time effect, F(1.964, 11.78)=0.5391, p=0.5939, NS, frequency effect, F(1, 6)=0.2474, p=0.6366, NS, Sidak’s multiple comparisons test, 0-5 min, p=0.8256, NS, 5-10 min, p=0.8824, NS, 10-15 min, p=0.9794, NS, 15-20 min, p=0.9995, NS). ChR2 6 Hz vs. ChR2 20 Hz (2-WAY RM ANOVA, time x frequency, F(1.455, 7.274)=7.391, *p=0.0223, time effect, F(1.514, 7.571)=11.05, **p=0.0075, frequency effect, F(1, 5)=20.99, **p=0.0059, Sidak’s multiple comparisons test, 0-5 min, ***p=0.0008, 5-10 min, p=0.2586, NS, 10–15 min, p=0.5763, NS, 15–20 min, p=0.3504, NS). (g) Distance travelled during 6 Hz and 20 Hz real-time stimulation (2-WAY ANOVA, frequency x genotype, F(1,22)=2.581, p=0.1224, NS, frequency effect, F(1, 22) = 0.3967, p=0.5353, NS, genotype effect, F(1, 22)=0.5732, p=0.457, NS, Sidak’s multiple comparisons test, 6 Hz GFP vs. ChR2, p=0.8013, NS, 20 Hz GFP vs. ChR2, p=0.2058, NS). (h) Conditioned aversion memory tested 24-hr after real time place aversion tests (two-way ANOVA, frequency x genotype, F(1,22)=6.208, *p=0.0207, frequency effect, F(1, 22) = 9.411, **p=0.0056, genotype effect, F(1, 22)=31.19, ****p<0.0001, Sidak’s multiple comparisons test, 6 Hz GFP vs. ChR2, p=0.0778, NS, 20 Hz GFP vs. ChR2, ****p<0.0001). (i) Distance travelled during the conditioned place aversion test (two-way ANOVA, frequency x genotype, F(1,22)=0.2058, p=0.6545, NS, frequency effect, F(1, 22) = 1.998, p=0.1715, NS, genotype effect, F(1, 22)=0.06095, p=0.8073, NS, Sidak’s multiple comparisons test, 6 Hz GFP vs. ChR2, p=0.8596, NS, 20 Hz GFP vs. ChR2, p=0.9868, NS). All results reported are mean ± s.e.m. *p < 0.05, **p < 0.01, ***p < 0.001, ****p < 0.0001.

