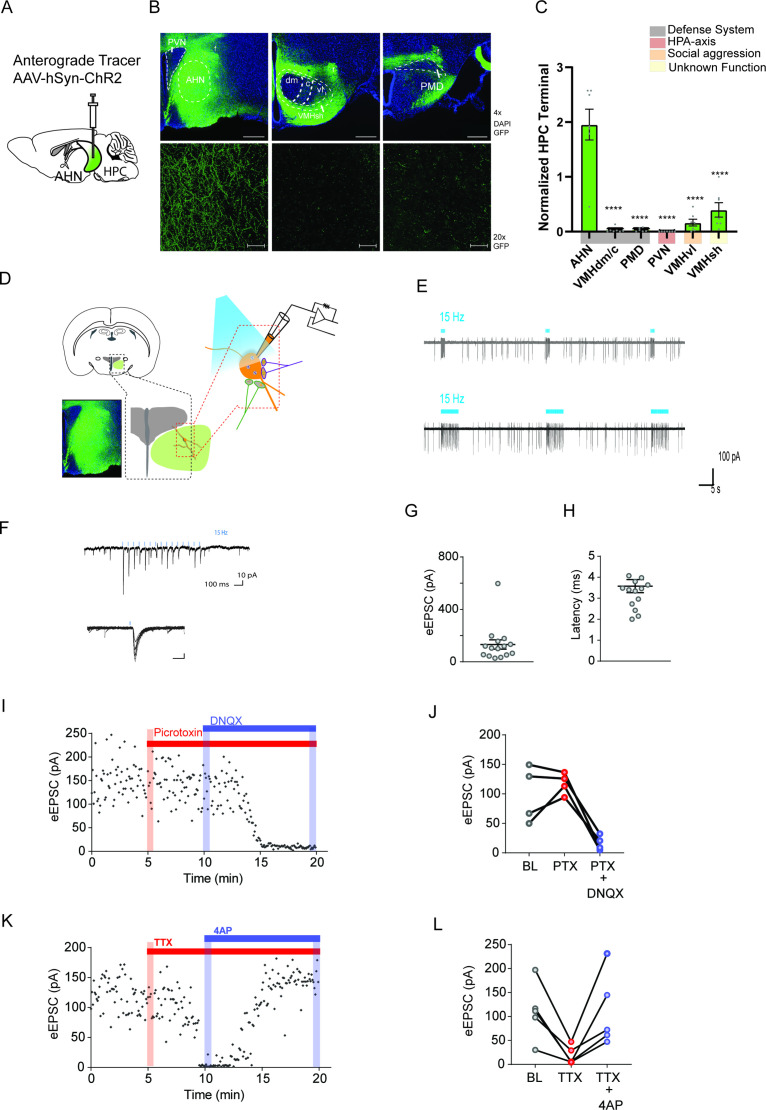
Figure 3. Hippocampus sends monosynaptic excitatory inputs to the anterior hypothalamic nucleus.
(a) Schematic illustration of anterograde tracing experiment. (b) HPC terminals (green) in the hypothalamus, including anterior hypothalamic nucleus (AHN), dorsomedial and central regions of ventromedial hypothalamus (VMHdm/c), premammillary dorsal nucleus (PMD), paraventricular nucleus (PVN), ventrolateral region of ventromedial hypothalamus (VMHvl), shell of ventromedial hypothalamus (VMHsh). DAPI staining (blue). (c) Quantification of HPC terminal intensity (N=2 animals, ~7 sections per ROI, One-Way ANOVA, F(5,35)=33.24, ****p<0.0001, Dunnett’s multiple comparisons test, AHN vs. VMHdm/c, ****p<0.0001, AHN vs. PMD, ****p<0.0001, AHN vs. PVN, ****p<0.0001, AHN vs. VMHvl, ****p<0.0001, AHN vs. VMHsh, ****p<0.0001). (d) Schematic illustration for patch clamp recordings of AHN neurons in coronal brain slices that express ChR2 in HPC terminals. (e) Examples of cell attach recordings. Illumination of blue light (480 nm, 5ms pulse at 15 Hz) triggered firing of AHN neurons. (f) Examples of whole-cell voltage-clamp recordings of AHN neurons. Blue light illumination (5 ms) evoked inward current. (g-h) Summary of light-evoked EPSCs (g) amplitude and latency (h). (i) Light-evoked EPSCs persisted in the presence of GABA A receptor antagonist picrotoxin (PTX, 100 µM) and eliminated by AMPA/kainite receptor antagonist DNQX (20 µM). (j) Summary of eEPSC change after PTX and DNQX application. (k) Light-evoked EPSCs were eliminated by TTX (0.5 µM) and then recovered by a low dose 4-AP (100 µM). (l) Summary of eEPSC changes after TTX and 4-AP application. All results reported are mean ± s.e.m. *p < 0.05, **p < 0.01, ***p < 0.001, and ****p<0.0001. Scale bar=100 µm.


