. 2022 Apr 14;11:e74736. doi: 10.7554/eLife.74736

Figure 4. HPC→AHN pathway activation induces escape-associated locomotion.

(a) Schematic illustration of optogenetic activation of hippocampal terminals in the AHN (GFP N=10, ChR2 N=10). (b) An example of histological confirmation showing the expression of HPC terminals and placement of optic fibers in the AHN. (c) Schematic describing optogenetic stimulation paradigm. (d) Two different escape conditions where the effects of HPC terminal stimulation was examined. Top: open field arena with short transparent walls (condition 1, easy). Bottom: physical restraint tube (condition 2, impossible). (e) Condition 1: speed increase from the light OFF epoch to ON epoch (two-way ANOVA, frequency x genotype, F(1,36)=5.298,*p=0.0272, frequency effect, F(1, 36)=2.337, p=0.135, NS, genotype, F(1, 36)=7.164, *p=0.0111, Sidak’s multiple comparisons test, 6 Hz GFP vs. ChR2, p=0.957, NS, 20 Hz GFP vs. ChR2, **p=0.0024). (f) Condition 1: freezing time during the light ON epoch (two-way ANOVA, frequency x genotype, F(1,36)=0.04839, p=0.8273, NS, frequency effect, F(1, 36)=1.637, p=0.2089, NS, genotype effect, F(1, 36) = 2.385e-005, p=0.9961, NS, Sidak’s multiple comparisons test, 6 Hz GFP vs. ChR2, p=0.9856, NS, 20 Hz GFP vs. ChR2, p=0.9843, NS). (g) Condition 1: rearing time during the light ON epoch (two-way ANOVA, frequency x genotype, F(1,36)=0.06028, p=0.8075, NS, frequency effect, F(1, 36)=1.08, p=0.3057, NS, genotype effect, F(1, 36)=0.04343, p=0.8361, NS, Sidak’s multiple comparisons test, 6 Hz GFP vs. ChR2, p=0.9996, NS, 20 Hz GFP vs. ChR2, p=0.9375, NS) (h) Condition 1: grooming time during the light ON epoch (two-way ANOVA, frequency x genotype, F(1,36)=3.858, p=0.0573, NS, frequency effect, F(1,36) = 0.03451, p=0.8537, NS, genotype effect, F(1,36)=1.024, p=0.3184, NS, Sidak’s multiple comparisons test, 6 Hz GFP vs. ChR2, p=0.083, NS, 20 Hz GFP vs. ChR2, p=0.7549, NS). (i) Condition 2: struggle movement during the 30 minutes of physical restraint (GFP N=7, ChR2 N=9, unpaired t-test, two-tailed, t=12.22, df=356 ****p<0.0001). All results reported are mean ± s.e.m. *p < 0.05, **p < 0.01, ***p < 0.001, ****p<0.0001. Scale bar=200µm.

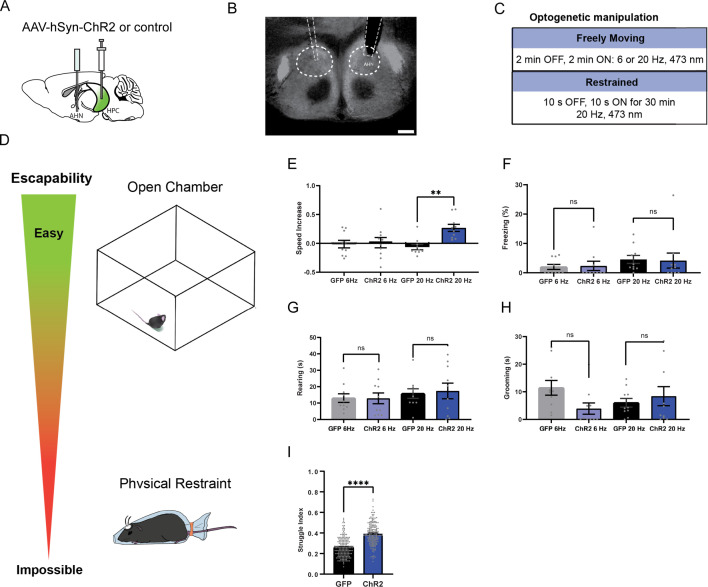
Figure 4—source data 1. Numerical data shown in Figure 4.
HPC→AHN pathway activation induces escape-associated locomotion.

Figure 4.

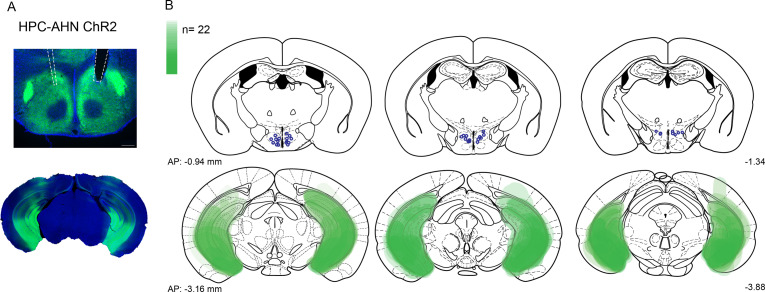
Figure 4—figure supplement 1. viral expression and optic fiber implantation sites for HPC→AHN pathway optogenetic activation a,b, HPC terminal activation in the AHN (N=22).

Figure 4—figure supplement 1.

Viral spread in all injection areas (AHN, HPC) are depicted by the green blots across coronal plates of mouse brain atlas. Color bar, the number of mice with viral expression in the area (DAPI, blue; ChR2, green). Scale bar 200 µm.
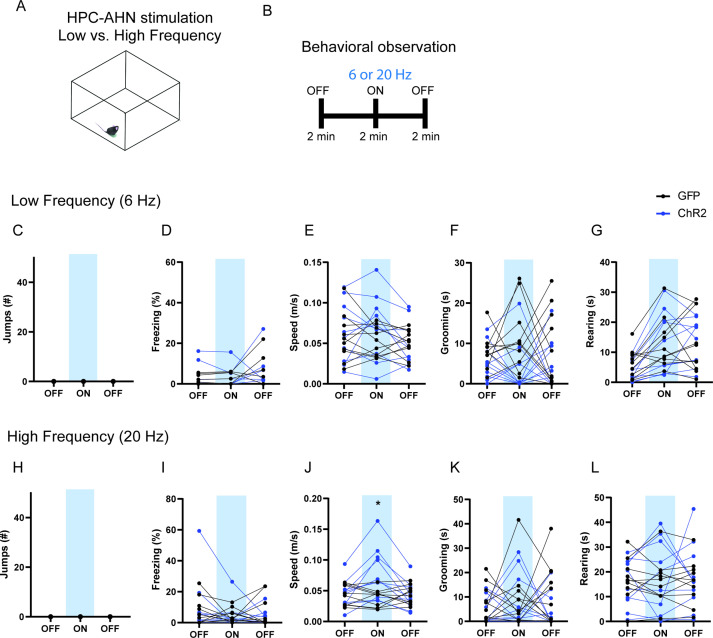
Figure 4—figure supplement 2. The effects of low- vs high-frequency HPC→AHN pathway activation.

Figure 4—figure supplement 2.

(a) Schematic illustration of open field box where the low- and high-frequency HPC→AHN pathway stimulation occurred. (b) Testing paradigm for with low- vs. high-frequency HPC→AHN pathway stimulation. (c–g) Behavioral changes induced by low-frequency (6 Hz) stimulation. (c) No jumping observed upon stimulation. (d) Freezing did not change (two-way RM ANOVA, light x genotype, F(2, 36) = 0.0762, p=0.9268, NS, light effect, F(1.040, 18.73) = 1.947, p=0.1793, NS, genotype effect, F(1, 18) = 0.1065, p=0.7479, NS). (e) Speed did not change (two-way RM ANOVA, light x genotype, F (2, 36) = 1.656, p=0.2051, NS, light effect, F(1.860, 33.48) = 2.281, p=0.1211, NS, genotype effect, F (1, 18) = 0.5189, p=0.4806, NS). (f) Grooming was decreased upon stimulation (two-way RM ANOVA, light x genotype, F(2, 36) = 0.6101, p=0.5488, NS, light effect, F(1.640, 29.53) = 0.08480, p=0.8846, NS, genotype, F(1, 18) = 10.22, **p=0.005). (g) Rearing did not change (two-way RM ANOVA, light x genotype, F (2, 36) = 0.5721, p=0.5694, NS, light effect, F (1.927, 34.69) = 13.27, ****p<0.0001, Sidak’s multiple comparison test, NS, genotype effect, F (1, 18) = 0.07171, p=0.7919, NS). (h–l) Behavioral changes induced by highfrequency (20 Hz) stimulation. (h) No jumping observed upon stimulation. (i) Freezing did not change (two-way RM ANOVA, light x genotype, F (2, 36) = 0.5866, p=0.5614, NS, light effect, F(1.693, 30.47) = 1.614, p=0.2173, NS, genotype effect, F (1, 18) = 0.0006919, p=0.9793, NS). (j) Speed was increased upon stimulation (two-way RM ANOVA, light x genotype, F (2, 36) = 15.26, ****p<0.0001, light effect, F (1.779, 32.02) = 8.293, **p=0.0018, genotype effect, F (1, 18) = 1.916, p=0.1832, NS, Sidak’s multiple comparison test, ON, *p=0.0402). (k) Grooming did not change (two-way RM ANOVA, light x genotype, F(2, 36) = 0.3965, p=0.6756, NS, light effect, F (1.839, 33.09) = 0.5543, p=0.5653, NS, genotype effect, F(1, 18) = 2.738, p=0.1153.) (l) Rearing did not change (two-way RM ANOVA, light x genotype, F (2, 36) = 0.2581, p=0.7739, NS, light effect, F (1.715, 30.86) = 0.03206, p=0.9524, NS, genotype effect, F (1, 18) = 0.03084, p=0.8626, NS). Sidak’s multiple comparison test: *p < 0.05, **p < 0.01, ***p < 0.001, ****p<0.0001.
Figure 4—figure supplement 2—source data 1. Numerical data shown in Figure 4—figure supplement 2.
The effects of low- vs. high-frequency HPC→AHN pathway activation.