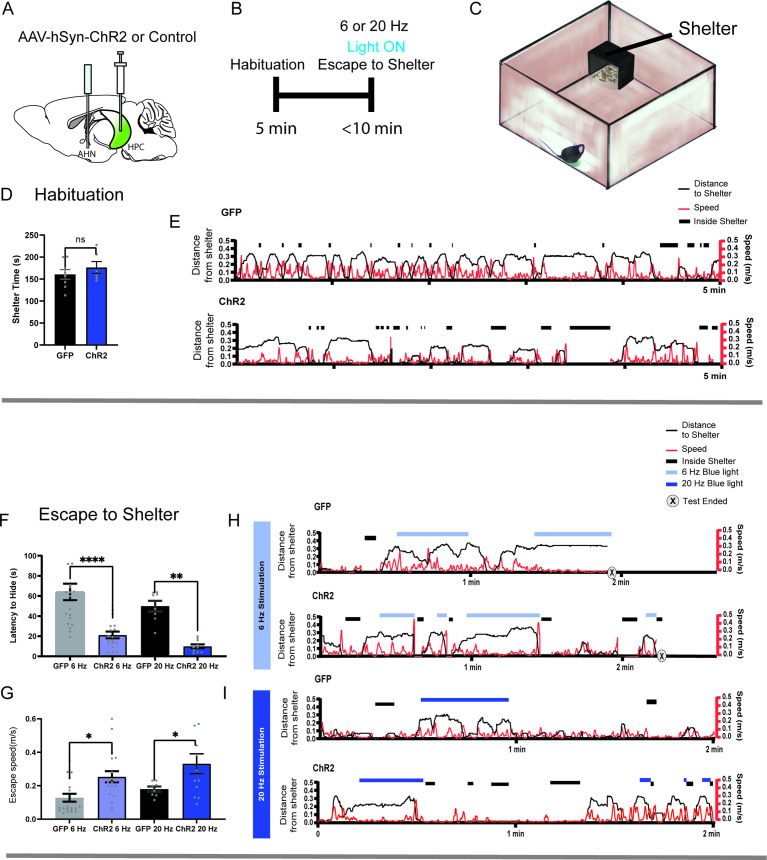
Figure 7. HPC→AHN pathway activation induces goal-directed escape.
(a) Schematic illustration of optogenetic HPC terminal activation in the AHN. (b) Schematic describing a test paradigm consisting of habituation (5 min) and a 6 or 20 Hz stimulation stage to induce shelter-directed escapes. (c), A cartoon drawing of the open field arena with a shelter box. (d) Time spent in the shelter during habituation (GFP N=8, ChR2 N=6, unpaired t-test, two-tailed, t=0.9241, df=12, p=0.3736, NS). (e) Representative line graphs for GFP (top) and ChR2 (bottom) mice, showing distance from shelter (black lines), speed (red lines), and moments when mice were inside the shelter (black boxes) over the 5 min habituation period. (f) Latency to escape to the shelter after optogenetic HPC terminal activation. (two-way ANOVA, frequency x genotype, F(1, 52) = 0.04138, p=0.8396, NS, frequency effect, F(1, 52)=3.268, p=0.0764, NS, genotype effect, F(1, 52)=34.71, ****p<0.0001, Sidak’s multiple comparisons test, 6 Hz GFP vs. ChR2, ****p<0.0001, 20 Hz GFP vs. ChR2, **p=0.0023). (g) Speed of escape running. 2-WAY ANOVA, frequency x genotype, F(1, 55) = 0.1134, p=0.7375, NS, frequency effect, F(1, 55)=2.78, p=0.1011, NS, genotype effect, F(1, 55)=12.65, ***p=0.008, Sidak’s multiple comparisons test, 6 Hz GFP vs. ChR2, *p=0.0139, 20 Hz GFP vs. ChR2, *p=0.0413. (h, i) Representative line graphs for GFP and ChR2 mice, showing distance from shelter (black lines), speed (red lines), and moments when mice were inside the shelter (black boxes) during the 6 Hz (h) and 20 Hz (i) HPC terminal stimulation stage. Light and dark blue highlights indicate the duration of 6 Hz and 20 Hz light stimulation, respectively, and (x) denotes test termination time. All results reported are mean ± s.e.m. *p < 0.05, **p < 0.01, ***p < 0.001, ****p<0.0001.

