. 2022 Apr 14;11:e74736. doi: 10.7554/eLife.74736

Figure 8. HPC→AHN pathway is necessary for goal-directed escape.

(a) Schematic illustration of optogenetic HPC terminal inhibition in the AHN (GFP N=7 and ArchT N=15). (b) Schematic describing a test paradigm consisting of habituation (7 min) and a threat delivery stage during which ultrasound (20 kHz, 9s) is turned on after mice voluntarily come out of the shelter to induce a shelter-directed escape. (c), Top view of testing apparatus, a modified Barnes maze. ‘s’ denotes the position where a shelter was placed. The red speaker sign denotes the auditory threat played from a speaker above the apparatus centre. (d) Time spent in the shelter during habituation stage (unpaired t-test, t=0.1698, df=20, p=0.8668, NS). (e) Representative ultrasound-evoked escape trajectories for a Wild type (WT) when a shelter is available (left) vs. WT when no shelter is available (right). (f) Representative ultrasound-evoked escape trajectories for a GFP control (left) and ArchT (right). (e,f) Individual threat presentation as a trial is numbered next to a square box, which denotes the animals’ starting position at the beginning of 9 s of 20 kHz sound. Dot color along the trajectory lines reflects animals’ speed. The arrows track animals’ head direction. The heatmap colorbar displays the scale of speed (pix/s). (g) Accuracy of reaching the shelter during escape. (unpaired t-test, t=3.149, df=33, **p=0.0034). (h), The linearity of escape trajectories expressed as the percentage ratio between the length of escape trajectory and a linear distance from escape onset position (i.e. ultrasound onset) to the shelter (unpaired t-test, t=3.266, df=31, **p=0.0027). (i) Time elapsed from the ultrasound onset to the shelter arrival (unpaired t-test, t=3.666, df=33, ***p=0.0008). (j) Time elapsed to reach the maximum speed during escape running to the shelter (unpaired t-test, t=3.134, df=31, **p=0.0036). (k) Time spent in freezing between the ultrasound onset and the shelter arrival (unpaired t-test, t=2.261, df=33, *p=0.0305). (l) c-Fos immunochemical detection across the medial hypothalamic defense system (AHN, VMHdm/c, PMD). First row, representative 4x epi-fluorescence microscope images of the medial hypothalamic defense system in GFP control mice. The regions of interest (ROI, white squares) within AHN, VMHdm/c, and PMD were imaged by confocal microscopy for cell counting. Second and third row: representative 20x confocal images of c-Fos signals in AHN, VMHdm/c, and PMD activated by ultrasound-evoked escapes with a shelter available in GFP (second row) and ArchT mice (third row). Fourth row: representative 20x confocal images of c-Fos signals activated by ultrasound-evoked escapes without shelter in controls. (m) Density of c-Fos signals activated by ultrasound-evoked escapes in AHN, VMHdm/c, and PMD in GFP controls with shelter (black), ArchT mice with shelter (green), and controls without shelter (grey) (N=5 mice for each group). AHN (1-WAY ANOVA, F(2,12)=6.171, *p=0.0144, Sidak’s multiple comparison test, Control Shelter vs. ArchT Shelter, *p=0.0177, Control Shelter vs. Control No Shelter, *p=0.0237), VMHdm/c (one-way ANOVA, F(2,12)=1.824, p=0.2035, NS, Sidak’s multiple comparison test, Control Shelter vs. ArchT Shelter, p=0.5391, NS, Control Shelter vs. Control No Shelter, p=0.1548), PMD (one-way ANOVA, F(2,12)=1.25, p=0.3212, NS, Sidak’s multiple comparison test, Control Shelter vs. ArchT Shelter, p=0.9665, NS, Control Shelter vs. Control No Shelter, p=0.3058, NS). Two-way ANOVA (ROI x treatment, F(4,36)=2.347, p=0.0729, NS, ROI effect, F(2,36) = 1.391, p=0.262, NS, treatment effect, F(2,36)=2.44, p=0.1015, NS, Sidak’s multiple comparisons test). AHN (Control Shelter vs. ArchT Shelter, p=0.1064, NS, Control Shelter vs. No Shelter, p=0.1344, ArchT Shelter vs. No Shelter, p=0.9993, NS), VMHdmd/c (Control Shelter vs. ArchT Shelter, p=0.4470, NS, Control Shelter vs. No Shelter, *p=0.0476, ArchT Shelter vs. No Shelter, p=0.5876, NS), PMD (Control Shelter vs. ArchT Shelter, p=0.9957, NS, Control Shelter vs. No Shelter, p=0.4999, NS, ArchT Shelter vs. No Shelter, p=0.6378, NS). Scale bar = 100 μm for 4x epi-fluorescence microscope images and 10 μm for 20 x confocal images. (PVN, paraventricular nucleus. f, fornix).

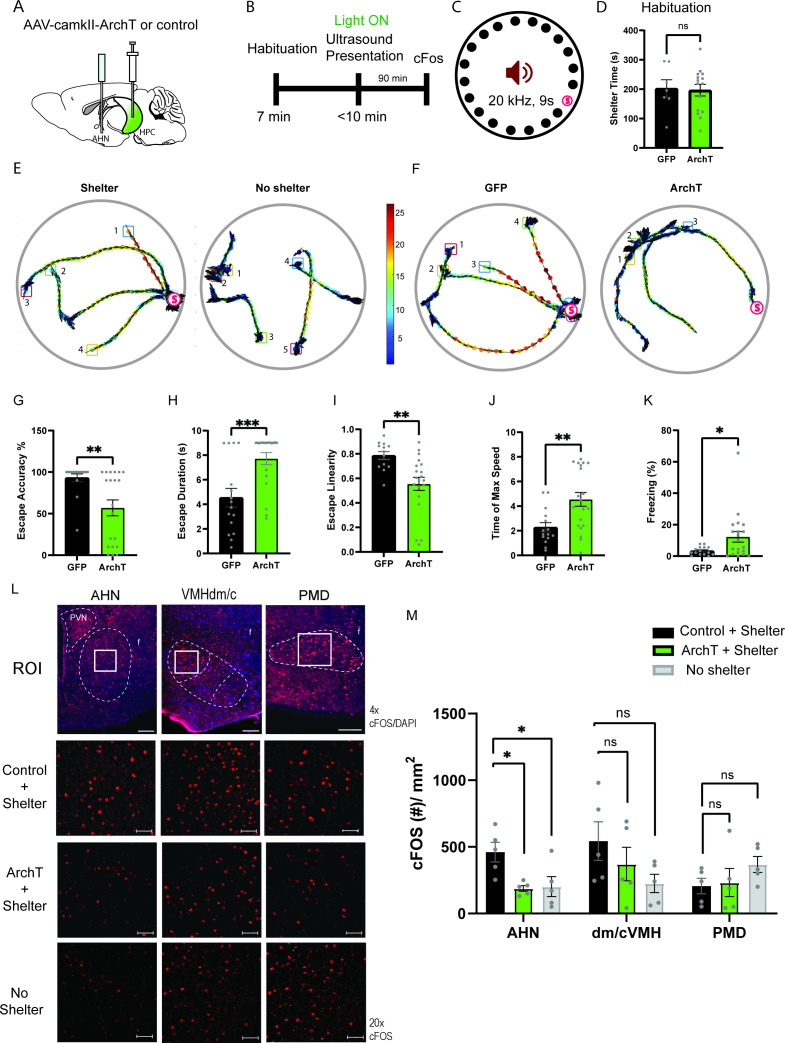
Figure 8.

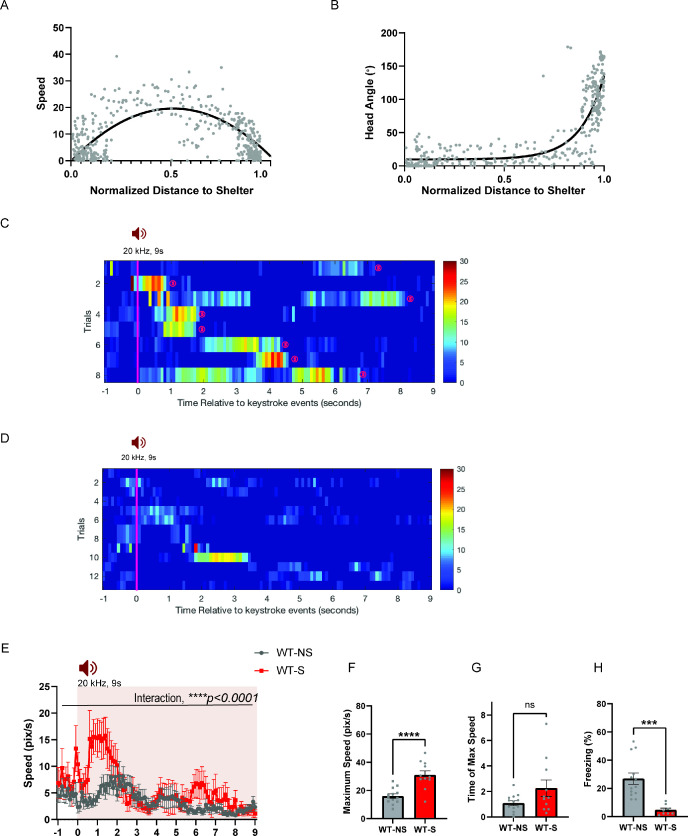
Figure 8—figure supplement 1. Mice display shelter-directed escape or freezing depending on the shelter availability.

Figure 8—figure supplement 1.

(a) During ultrasound (US)-evoked escape responses, C57BL6 wild type mice (WT) run toward the shelter and reach the maximum speed in the middle of the escape trajectory to the shelter (WT-Best fit, quadratic, y=19.57–3.757x+ 0.5372–75.48 x2, maximum speed at x=0.5372). (b) Mice turn their head toward the shelter quickly after they initiate escape flights Best fit, sigmoidal, y = 7.433 + (1412478–7.433)/(1+10Log0.4760-x). (c) Rastor plots of speed profile for WT animals’ escape flights to the shelter. (d) Representative escape trajectories of wildtype mice when shelter is not available. Right, Rastor plots of speed profile for WT animals’ escape flights when shelter is not available. Pink line denotes the US onset which lasted 9 s. Animals’ arrivals at the shelter are denoted by ‘(s)’. Dot colors along the trajectory denote speed according to the color map on the right. (e) Changes in speed (pix/s) 1 second before and 9 s after the US onset (WT-NS N = 13, WT-S N = 8, two-way RM ANOVA, time x shelter availability, F(100,1900) = 2.156, ****p < 0.0001, time effect, F(7.912, 150.3) = 4.619, ****p < 0.0001, shelter availability, F(1,19)=10.15, **p = 0.0049). (f) Maximum speed during escape running (unpaired t-test, t = 4.761, df = 22, ****p < 0.0001), (g) Time elapsed to reach the maximum speed during escape running (unpaired t-test, t = 1.869, df = 22, p = 0.075, NS). (h) Time spent in freezing during the US presentation (unpaired t-test, t = 4.266, df = 19, ***p = 0.0004). WT-NS: Wild-type mice with no shelter. WT-S: Wild-type mice with shelter. All results reported are mean ± s.e.m. *p < 0.05, **p < 0.01, ***p < 0.001, ****p < 0.0001.
Figure 8—figure supplement 1—source data 1. Numerical data shown in Figure 8—figure supplement 1.
Mice display shelter-directed escape or freezing depending on the shelter availability.
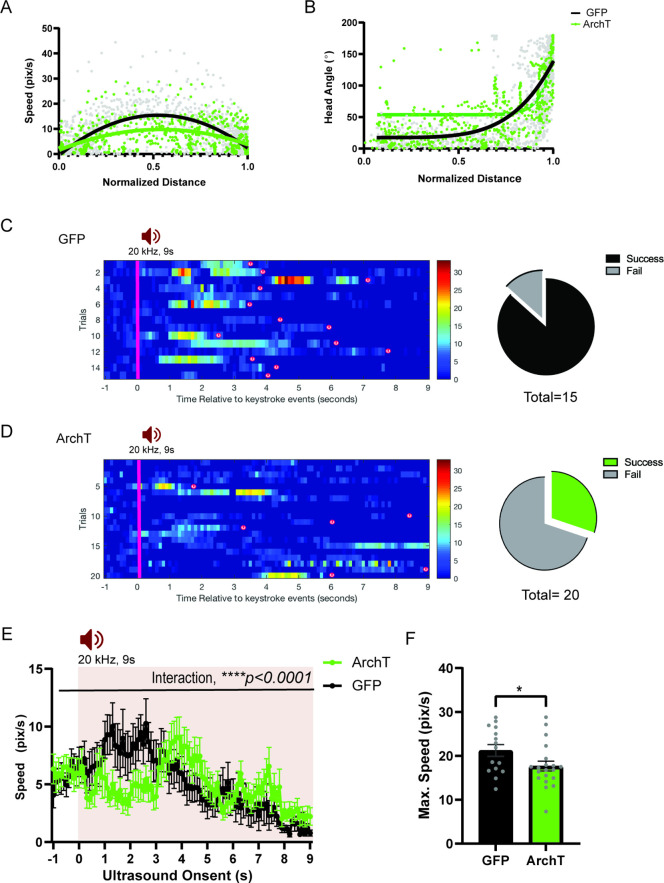
Figure 8—figure supplement 2. HPC→AHN pathway inhibition impairs ultrasound (US)-evoked escape responses.

Figure 8—figure supplement 2.

(a) Comparison between GFP (N=16) and ArchT (N=20) mice for speed (pixel/s) plotted in relation to the normalized distance to the shelter (GFP best fit line, y=15.34–5.226 x-58.01x2,, maximum speed at x=0.5706; ArchT best fit line, y=9.768–0.2301x-28.23x2, maximum speed at x=0.5444). (b) Head angle plotted in relation to the normalized distance to the shelter (GFP best fit line, y = 17.50 + (126075–4.765)/(1+10Log0.6336-x); ArchT best fit line, y=53.72 + (35041837–14.89)/(1+10Log0.3752-x)). (c) Left, Rastor plots of speed profile for GFP. Right, Pie chart comparing the number of successful or failing escape responses upon ultrasound presentation (GFP: total 15 trials, 2 fails, 13 successes), (d) Left Rastor plots of speed profile for ArchT. Right, Pie chart comparing the number of successful or failing escape responses upon ultrasound presentation (ArchT: total 20 trials, 14 fails, 6 successes). Pink line denotes the US onset which lasted 9s. Animals’ arrivals at the shelter are denoted by ‘(s)’. (e) Changes in speed (pix/s) 1 s before and 9 s after the US onset (two-way RM ANOVA, time x genotype, F (100, 3400) = 1.638, ****p < 0.0001, time effect, F(7.109, 241.7) = 3.668, ***p = 0.0008, genotype effect, F(1,34)=2.974e-005, p=0.9957, NS). (f) Maximum speed during escape running (unpaired t-test, t=2.047, df=33, *p = 0.0487). All results reported are mean ± s.e.m. *p < 0.05, **p < 0.01, ***p < 0.001, ****p<0.0001.
Figure 8—figure supplement 2—source data 1. Numerical data shown in Figure 8—figure supplement 2.
HPC→AHN pathway inhibition impairs ultrasound (US)-evoked escape responses.
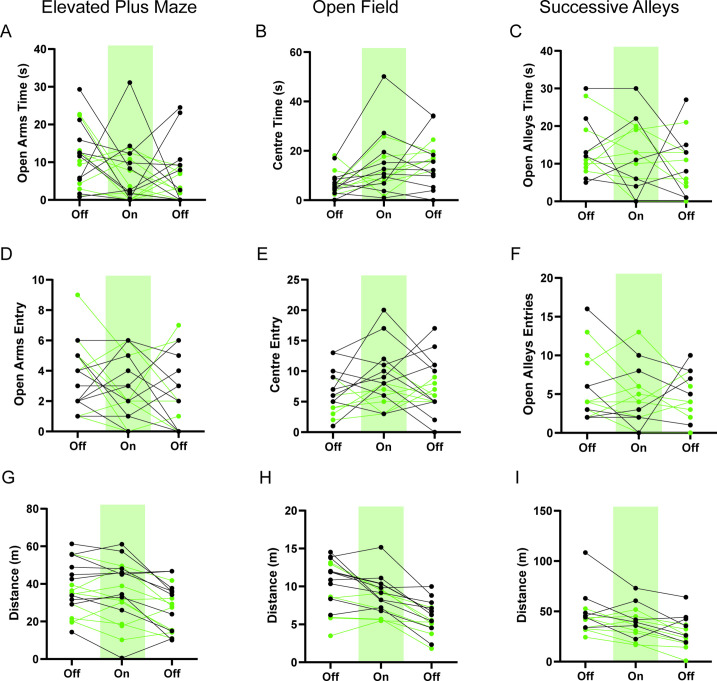
Figure 8—figure supplement 3. HPC→AHN pathway inhibition does not change anxiety-related behaviors.

Figure 8—figure supplement 3.

(a) Time spent in the open arms in the elevated plus maze (EPM) (GFP N=10, ArchT N=9, two-way RM ANOVA, time x genotype, F(2,34)=0.1412, NS, time effect, F(1.902, 32.33)=2.278, p=0.1209, NS genotype effect, F(1,17)=1.244, p=0.2802, NS). (b) Time spent in the center of the open field (OF) (GFP N=10, ArchT N=7, 2-WAY RM ANOVA, time x genotype, F(2,30)=1.142, p=0.3326, NS, time effect, F(1.896, 28.44)=6.736, **p=0.0046, genotype effect, F(1,15)=0.001859, p=0.9662, NS). (c) Time spent in the open alleys of successive alleys (SA) (GFP N=6 ArchT N=8, two-way RM ANOVA, time x genotype, F(2,24)=0.07654, p=0.9265, NS, time effect, F(1.758, 21.1)=1.147, p=0.3303, NS, genotype effect, F(1,12)=0.04910, p=0.8284, NS). (d) Number of entries into the open arms of EPM (two-way RM ANOVA, time x genotype, F(2,34)=1.578, p=0.2211, NS, time effect, F(1.967, 33.45)=3.07, p=0.0604, NS, genotype effect, F(1, 17)=0.0005564, p=0.9815, NS). (e) Number of entries into the centre of the OF (two-way RM ANOVA, time x genotype effect, F(2,30)=0.8540, p=0.4358, NS, time effect, F(1.966, 29.49)=0.8676, p=0.4288, NS, genotype effect, F (1, 15) = 2.676, p=0.1227, NS). (f) Number of entries into the open alleys of SA (two-way RM ANOVA, time x genotype, F(2,24)=0.7369, p=0.4891, NS, time effect, F(1.976, 23.72)=1.154, p=0.332, NS, genotype effect, F(1,12)=0.01358, p=0.9092, NS). (g) Distance travelled in the EPM (2-WAY RM ANOVA, time x genotype, F(2,34)=0.4192, p=0.6609, NS, time effect, F (1.541, 26.20) = 14.80, ****p=0.0001, genotype effect, F (1, 17) = 1.855, p=0.1910, NS). (h) Distance travelled in the OF (two-way RM ANOVA, time x genotype, F(2,30)=0.5938, p=0.5586, NS, time effect, F(1.711, 25.67)=28.53, ***p<0.0001, genotype effect, F (1, 15) = 5.255, *p=0.0368). (i) Distance travelled in the SA (two-way RM ANOVA, time x genotype, F(2,24)=0.5972, NS, time effect, F(1.902, 22.82) = 13.14, ***p = 0.0002, genotype effect, F(1, 12) = 4.473, p = 0.0560, NS). All results reported are mean ± s.e.m.
Figure 8—figure supplement 3—source data 1. Numerical data shown in Figure 8—figure supplement 3.
HPC→AHN pathway inhibition does not change anxiety-related behaviors.