. 2022 Apr 26;11:e74275. doi: 10.7554/eLife.74275

Figure 6. Inhibitory proteins block access of the Pro-σK(1–127) N-terminal region to the SpoIVFB active site and hinder interaction with the SpoIVFB membrane-reentrant loop and interdomain linker.

(A) E44C at the cytTM-SpoIVFB active site forms abundant disulfide cross-links with V20C or K24C in the N-terminal region of Pro-σK(1–127) in the absence of inhibitory proteins. pET Duet plasmids were used to produce single-Cys E44C cytTM-SpoIVFB in combination with single-Cys F18C (pSO167), V20C (pSO169), S21C (pSO170), or K24C (pSO128) Pro-σK(1–127), or with Cys-less Pro-σK(1–127) (pSO79) as a negative control, in Escherichia coli. Samples collected after 2 hr of IPTG induction were treated with Cu2+(phenanthroline)3 oxidant for 15, 30, 45, or 60 min to promote disulfide bond formation and subjected to immunoblot analysis with FLAG antibodies to visualize the cytTM-SpoIVFB monomer, dimer, and complex with Pro-σK(1–127) (Figure 6—figure supplement 1A). Abundance of the complex was divided by the total amount of cytTM-SpoIVFB monomer, dimer, and complex. The ratio over time was plotted (n=2) with a best-fit trend line. (B) Representative immunoblots of 60 min samples from the experiment are described in (A). (C) MBPΔ27BofA and SpoIVFA decrease cross-linking between E44C cytTM-SpoIVFB and V20C or K24C Pro-σK(1–127). pET Quartet plasmids were used to produce single-Cys E44C cytTM-SpoIVFB in combination with single-Cys F18C (pSO163), V20C (pSO165), S21C (pSO166), or K24C (pSO131) Pro-σK(1–127), or with Cys-less Pro-σK(1–127) (pSO110) as a negative control, and Cys-less variants of MBPΔ27BofA and SpoIVFA in E. coli. Samples collected after 2 hr of IPTG induction were treated and subjected to immunoblot analysis as in (A) (Figure 6—figure supplement 1B). The complex/total ratio was plotted as in (A). (D) Representative immunoblots of 60 min samples from the experiment are described in (C). (E, F) Summaries of the effects of inhibitory proteins on cross-linking between E44C cytTM-SpoIVFB and V20C or K24C Pro-σK(1–127). Data from (A) (labeled ‘No BofA’ in (E), although SpoIVFA is also absent), (C) (labeled ‘MBPΔ27BofA’ in (E), although SpoIVFA is also present), and Figure 6—figure supplement 2 (labeled ‘BofA’ in (E), although SpoIVFA is also present) are plotted along with Cys-less Pro-σK(1–127) as a negative control. In (F), symbols and lines are as in (E). (G, H) Summaries of the effects of inhibitory proteins on cross-linking between V70C in the cytTM-SpoIVFB membrane-reentrant loop and F18C or K24C in the Pro-σK(1–127) N-terminal region. Data from Figure 6—figure supplement 3 are plotted using symbols and lines as in (E). (I) Summary of the effects of inhibitory proteins on cross-linking between Y214C in the cytTM-SpoIVFB interdomain linker and L41C in the Pro-σK(1–127) N-terminal region. Data from Figure 6—figure supplement 5 are plotted using symbols and lines as in (E).

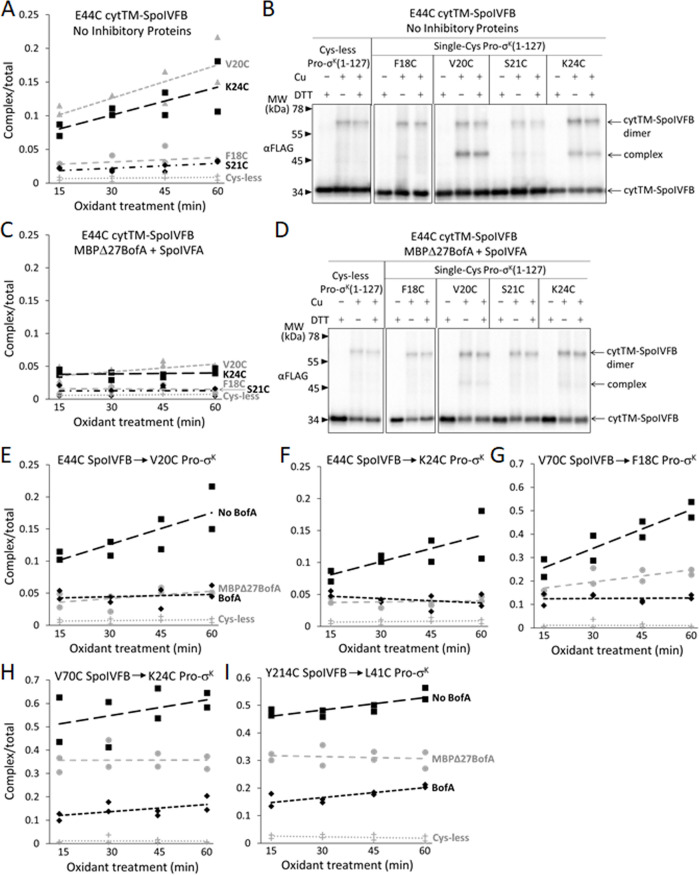
Figure 6—source data 1. Quantification of cross-linking (Figure 6A, C, and E–I).

Figure 6.

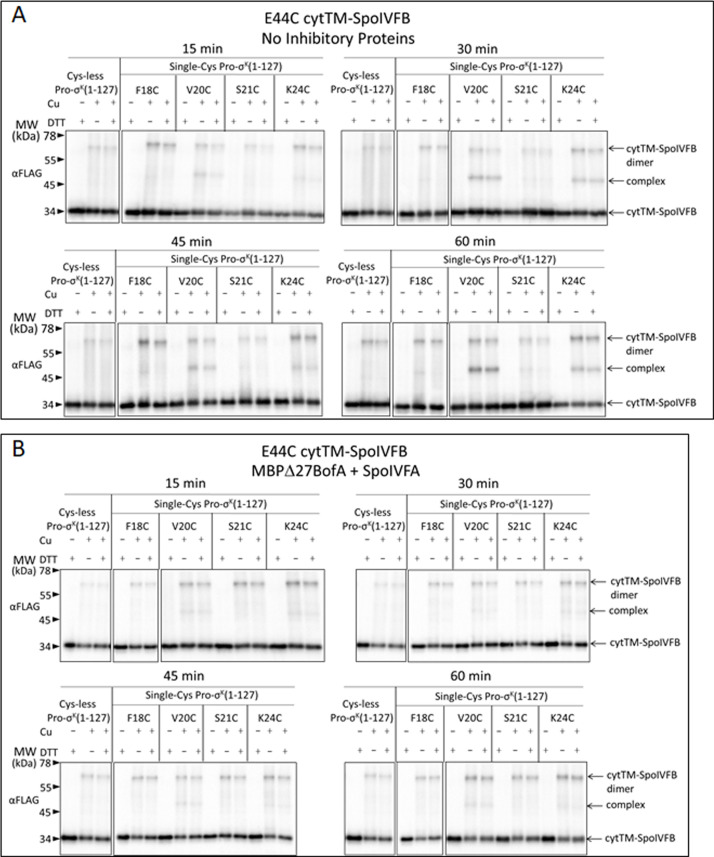
Figure 6—figure supplement 1. Disulfide cross-linking between E44C at the active site of cytTM-SpoIVFB and the Proregion of Pro-σK(1–127) in the absence of inhibitory proteins or in the presence of MBPΔ27BofA and SpoIVFA.

Figure 6—figure supplement 1.

(A) Time course of cross-linking between single-Cys E44C cytTM-SpoIVFB and single-Cys Pro-σK(1–127) variants in the absence of inhibitory proteins. See the Figure 6A legend for explanation of the experiment. (B) Time course of cross-linking between single-Cys E44C cytTM-SpoIVFB and single-Cys Pro-σK(1–127) variants in the presence of Cys-less variants of MBPΔ27BofA and SpoIVFA. See the Figure 6C legend for explanation of the experiment. Representative results from two biological replicates are shown in (A) and (B).
Figure 6—figure supplement 1—source data 1. Immunoblot images (raw and annotated) (Figure 6—figure supplement 1A).
Figure 6—figure supplement 1—source data 2. Immunoblot images (raw and annotated) (Figure 6—figure supplement 1B).
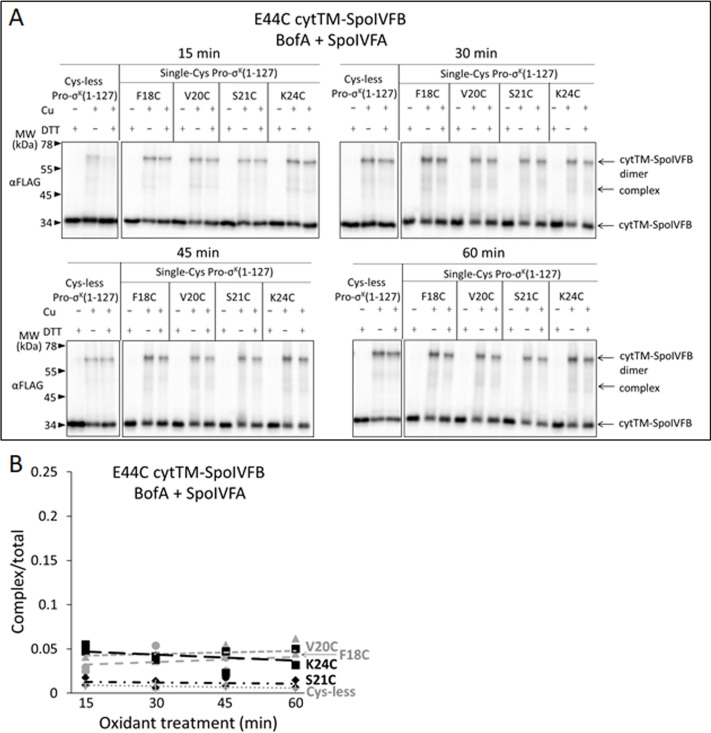
Figure 6—figure supplement 2. Full-length BofA and SpoIVFA decrease cross-linking between E44C cytTM-SpoIVFB and V20C or K24C Pro-σK(1–127).

Figure 6—figure supplement 2.

(A) Time course of cross-linking between single-Cys E44C cytTM-SpoIVFB and single-Cys Pro-σK(1–127) variants in the presence of Cys-less variants of BofA and SpoIVFA. pET Quartet plasmids were used to produce single-Cys E44C cytTM-SpoIVFB in combination with single-Cys F18C (pSO238), V20C (pSO234), S21C (pSO235), or K24C (pSO239) Pro-σK(1–127), or with Cys-less Pro-σK(1–127) (pSO229) as a negative control, and Cys-less variants of BofA and SpoIVFA in Escherichia coli. Samples collected after 2 hr of IPTG induction were treated and subjected to immunoblot analysis as explained in the Figure 6A legend. A representative result from two biological replicates is shown. (B) Quantification of cross-linking for the experiment is described in (A). Abundance of the complex was divided by the total amount of cytTM-SpoIVFB monomer, dimer, and complex. The ratio over time was plotted (n=2) with a best-fit trend line.
Figure 6—figure supplement 2—source data 1. Immunoblot images (raw and annotated) (Figure 6—figure supplement 2A) and quantification of cross-linking (Figure 6—figure supplement 2B).
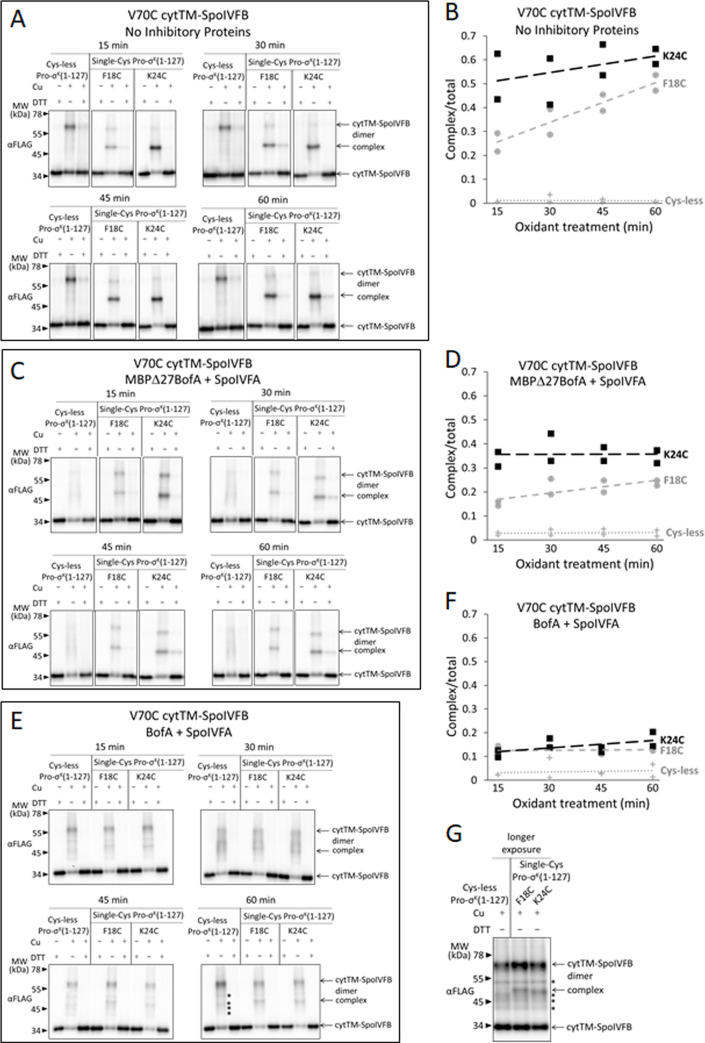
Figure 6—figure supplement 3. Disulfide cross-linking between V70C in the cytTM-SpoIVFB membrane-reentrant loop and F18C or K24C in the Pro-σK(1–127) N-terminal region is decreased more by full-length BofA than by MBPΔ27BofA (lacking TMS1).

Figure 6—figure supplement 3.

(A) Time course of cross-linking between the single-Cys V70C cytTM-SpoIVFB E44Q and single-Cys Pro-σK(1–127) variants in the absence of inhibitory proteins. pET Duet plasmids were used to produce single-Cys V70C cytTM-SpoIVFB E44Q in combination with single-Cys F18C (pSO168) or K24C (pSO134) Pro-σK(1–127), or with Cys-less Pro-σK(1–127) (pSO136) as a negative control, in Escherichia coli. Samples collected after 2 hr of IPTG induction were treated and subjected to immunoblot analysis as explained in the Figure 6A legend. A representative result from two biological replicates is shown. (B) Quantification of cross-linking for the experiment is described in (A). Abundance of the complex was divided by the total amount of cytTM-SpoIVFB monomer, dimer, and complex. The ratio over time was plotted (n=2) with a best-fit trend line. (C) Time course of cross-linking between single-Cys V70C cytTM-SpoIVFB E44Q and single-Cys Pro-σK(1–127) variants in the presence of Cys-less variants of MBPΔ27BofA and SpoIVFA. pET Quartet plasmids were used to produce single-Cys V70C cytTM-SpoIVFB E44Q in combination with single-Cys F18C (pSO164) or K24C (pSO132) Pro-σK(1–127), or with Cys-less Pro-σK(1–127) (pSO111) as a negative control, and Cys-less variants of MBPΔ27BofA and SpoIVFA in E. coli. Samples collected after 2 hr of IPTG induction were treated and subjected to immunoblot analysis as explained in the Figure 6A legend. A representative result from two biological replicates is shown. (D) Quantification of cross-linking for the experiment is described in (C). Quantification was performed as described in (B). (E) Time course of cross-linking between single-Cys V70C cytTM-SpoIVFB E44Q and single-Cys Pro-σK(1–127) variants in the presence of Cys-less variants of full-length BofA and SpoIVFA. pET Quartet plasmids were used to produce the single-Cys V70C cytTM-SpoIVFB E44Q in combination with single-Cys F18C (pSO236) or K24C (pSO237) Pro-σK(1–127), or with Cys-less Pro-σK(1–127) (pSO230) as a negative control, and Cys-less variants of BofA and SpoIVFA in E. coli. Samples collected after 2 hr of IPTG induction were treated and subjected to immunoblot analysis as explained in the Figure 6A legend. A representative result from two biological replicates is shown. (F) Quantification of cross-linking for the experiment is described in (E). Quantification was performed as described in (B). (G) Immunoblot of 60 min samples (Cu+) from the experiment is described in (E) with a longer exposure (10 s). Star (*) indicates four novel species.
Figure 6—figure supplement 3—source data 1. Immunoblot images (raw and annotated) (Figure 6—figure supplement 3A, C, E, and G) and quantification of cross-linking (Figure 6—figure supplement 3B, D, and F).
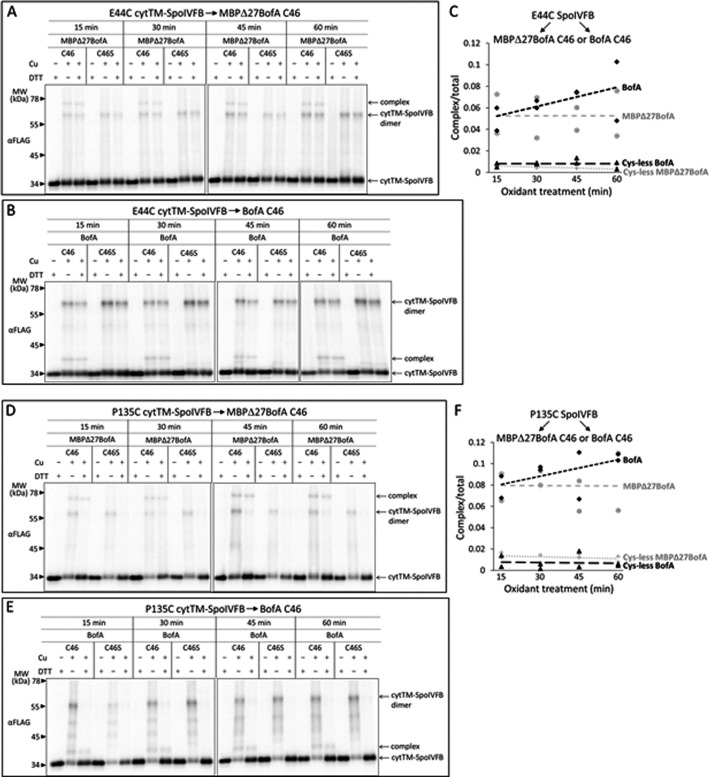
Figure 6—figure supplement 4. Comparison of disulfide cross-linking between C46 in TMS2 of full-length BofA or MBPΔ27BofA (lacking TMS1) and E44C at or P135C near the active site of cytTM-SpoIVFB.

Figure 6—figure supplement 4.

(A, B) Time courses of cross-linking between single-Cys E44C cytTM-SpoIVFB and MBPΔ27BofA C46 or full-length BofA C46. pET Quartet plasmids were used to produce single-Cys E44C cytTM-SpoIVFB in combination with MBPΔ27BofA C46 (pSO91) or BofA C46 (pSO226), or with Cys-less MBPΔ27BofA C46S (pSO110) or BofA C46S (pSO229) variants as negative controls, and Cys-less variants of Pro-σK(1–127) and SpoIVFA in Escherichia coli. Samples collected after 2 hr of IPTG induction were treated and subjected to immunoblot analysis as explained in the Figure 6A legend. A representative result from two biological replicates is shown. (C) Quantification of cross-linking for the experiments is described in (A, B). Abundance of the complex was divided by the total amount of cytTM-SpoIVFB monomer, dimer, and complex. The ratio over time was plotted (n=2) with a best-fit trend line. (D, E) Time courses of cross-linking between single-Cys P135C cytTM-SpoIVFB and MBPΔ27BofA C46 or full-length BofA C46. pET Quartet plasmids were used to produce single-Cys P135C cytTM-SpoIVFB E44Q in combination with MBPΔ27BofA C46 (pSO93) or BofA C46 (pSO228), or with Cys-less MBPΔ27BofA C46S (pSO112) or BofA C46S (pSO231) variants as negative controls, and Cys-less variants of Pro-σK(1–127) and SpoIVFA in E. coli. Samples collected after 2 hr of IPTG induction were treated and subjected to immunoblot analysis as explained in the Figure 6A legend. A representative result from two biological replicates is shown. (F) Quantification of cross-linking for the experiments is described in (D, E). Quantification was performed as described in (C).
Figure 6—figure supplement 4—source data 1. Immunoblot images (raw and annotated) (Figure 6—figure supplement 4A, B, D, and E) and quantification of cross-linking (Figure 6—figure supplement 4C and F).
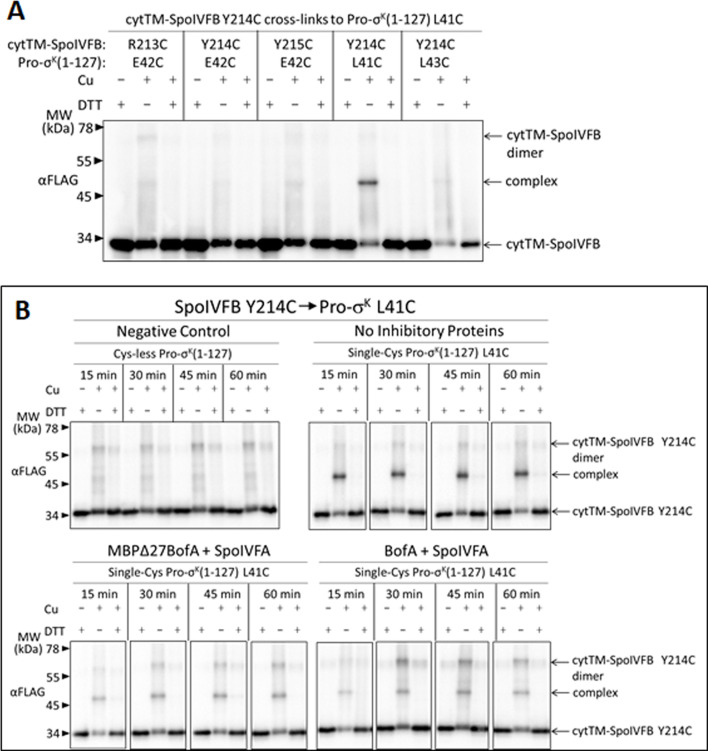
Figure 6—figure supplement 5. Disulfide cross-linking between Y214C in the cytTM-SpoIVFB interdomain linker and L41C in the Pro-σK(1–127) N-terminal region is decreased more by full-length BofA than by MBPΔ27BofA (lacking TMS1).

Figure 6—figure supplement 5.

(A) Cross-linking between single-Cys cytTM-SpoIVFB variants and single-Cys Pro-σK(1–127) variants. pET Duet plasmids (pSO117–pSO121) were used to produce single-Cys R213C, Y214C, or Y215C cytTM-SpoIVFB E44Q variants in combination with single-Cys L41C, E42C, or L43C Pro-σK(1–127) variants in Escherichia coli. Samples collected after 2 hr of IPTG induction were treated and subjected to immunoblot analysis as explained in the Figure 5—figure supplement 3A legend. A representative result from two biological replicates is shown. (B) Time course of cross-linking between Y214C in the cytTM-SpoIVFB interdomain linker and L41C in the Pro-σK(1–127) N-terminal region in the absence or presence of inhibitory proteins. pET Duet plasmids were used to produce single-Cys Y214C cytTM-SpoIVFB E44Q in combination with single-Cys L41C Pro-σK(1–127) from pSO120 or with Cys-less Pro-σK(1–127) from pSO114 as a negative control, in E. coli. pET Quartet plasmids were used to produce single-Cys Y214C cytTM-SpoIVFB E44Q, single-Cys L41C Pro-σK(1–127), and Cys-less SpoIVFA in combination with Cys-less MBPΔ27BofA from pSO127 or with Cys-less full-length BofA from pSO245 in E. coli. Samples collected after 2 hr of IPTG induction were treated and subjected to immunoblot analysis as explained in the Figure 6A legend. A representative result from two biological replicates is shown.
Figure 6—figure supplement 5—source data 1. Immunoblot images (raw and annotated).