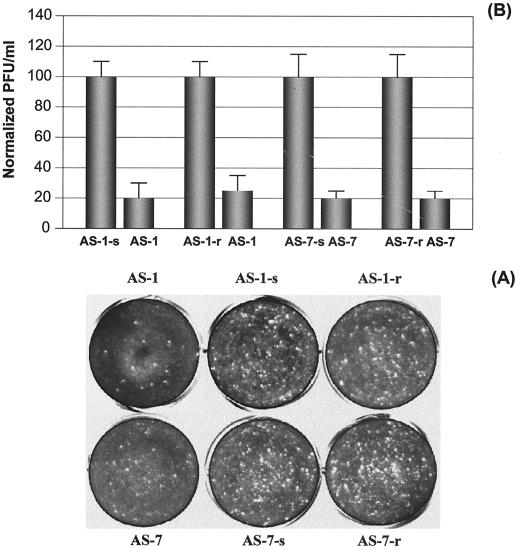
FIG. 9.
Further controlled evaluation of specific inhibition of plaque formation by AS-1 and AS-7 at a final concentration of 10 μM. All the procedures are the same as described in the legend to Fig. 8 except that two more controlled oligomers, scrambled and reverse sequences, for each AS-ODN were used. (A) Viral plaque assay. (B) Values (PFU per milliliter) for the control and treatment in each group. Each experiment was repeated three times. The means ± SD of controls were normalized to 100, and the values of treatments were calculated accordingly. The difference between each control and its respective ODN treatment was statistically significant (P < 0.01).

