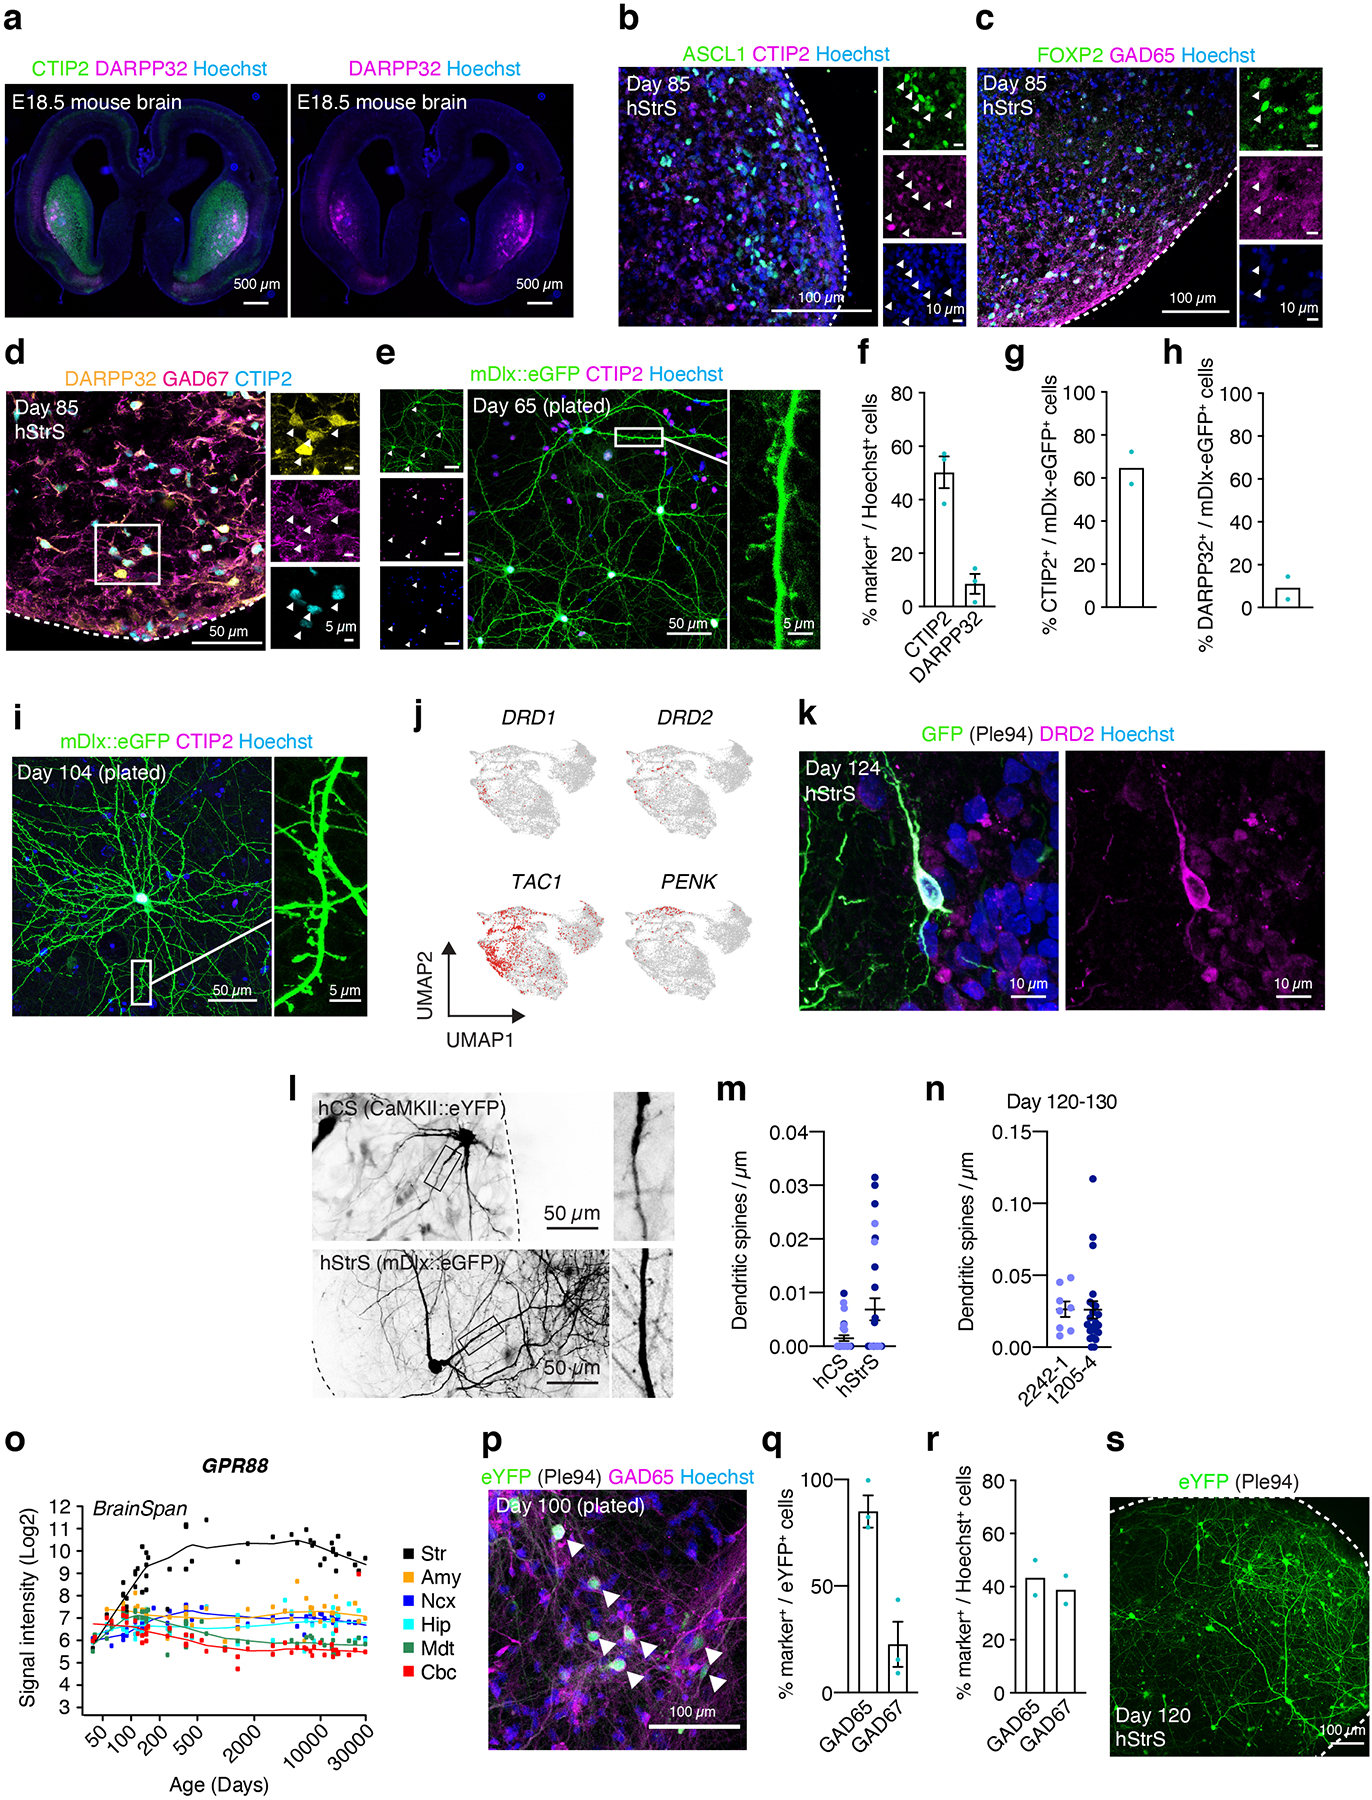
Extended Data Fig. 6. Characterization of hStrS neurons.

(a) Representative image of an E18.5 mouse brain section immunostained with antibodies against CTIP2 (BCL11B) (green), DARPP32 (magenta) and Hoechst (blue). Scale bar: 500 μm. (b–d) Immunostaining for ASCL1 (green), CTIP2 (magenta), Hoechst (blue) in b, FOXP2 (green), GAD65 (magenta) and Hoechst (blue) in c, DARPP32 (yellow), GAD67 (magenta) and CTIP2 (cyan) in d, hStrS at day 85. n = 3 hiPS cell lines. Scale bar: 100 μm in b,c, and 50 μm in d. (e–i) Representative immunocytochemistry images of dissociated hStrS neurons that have been labeled with an AAV-mDlx::eGFP at day 65 or at day 104. Scale bar: 50 μm for the left and middle image, and 5 μm for the right image (e). 50 μm for left, and 5 μm for right image (i). Quantification of CTIP2+ and DARPP32+ cells in mDlx::eGFP infected and 2D-plated hStrS cells. n = 3 neural spheroids from 2 hiPS cell lines in f, n = 2 neural spheroids from 2 hiPS cell lines in h. (j) Expression of DRD1, DRD2, TAC1, PENK in hStrS. (k) Immunostaining for GFP (green), DRD2 (magenta), Hoechst (blue), hStrS at day 124. Scale bar: 10 μm. Immunostainings were repeated in spheroids from 3 independent differentiation experiments with similar results. (l,m) Dendritic spine morphology of hCS neurons labelled with CaMKII::eYFP and of hStrS neurons labelled with AAV-mDlx::eGFP. Quantification of the number of dendritic spines (day 100–110: n = 26 neurons for hCS, n = 27 neurons for hStrS; from 2 hiPS cell lines; two-tailed, Mann-Whitney test, P = 0.17). (n) Quantification of number of dendritic spines (day 120–130: n = 8 neurons from the 2242–1 line, n = 22 neurons from the 1205–4 line; two-tailed, Mann-Whitney test, P = 0.44). (o) Gene expression of GPR88 in developing human brain in the BrainSpan transcriptome dataset (https://hbatlas.org/). (p) Representative image of dissociated hStrS neurons labeled with Ple94::iCre and DIO-eYFP at day 100. Expression of eYFP is induced by iCre expression under a mini-promoter including regulatory region of striatal gene GPR88 (Ple94). Arrow heads indicate eYFP+/GAD65+ cells. Scale bar: 100 μm. (q) Quantitative results showing percentage of GAD65+ and GAD67+ cells out of eYFP+ cells following recombination with the Ple94 reporter. n = 3 hiPS cell lines. (r) Percentage of GAD65+ and GAD67+ cells out of Hoechst+ cells (n = 2 differentiation with 2 iPS cell lines. (s) Representative confocal live image of hStrS labeled with Ple94::iCre and DIO-eYFP at day 120. Scale bar: 100 μm. Data shown are mean ± s.e.m. Imaging were repeated in spheroids from 2 independent differentiation experiments with similar results.
