
Extended Data Fig. 7. Functional characterization of hStrS.
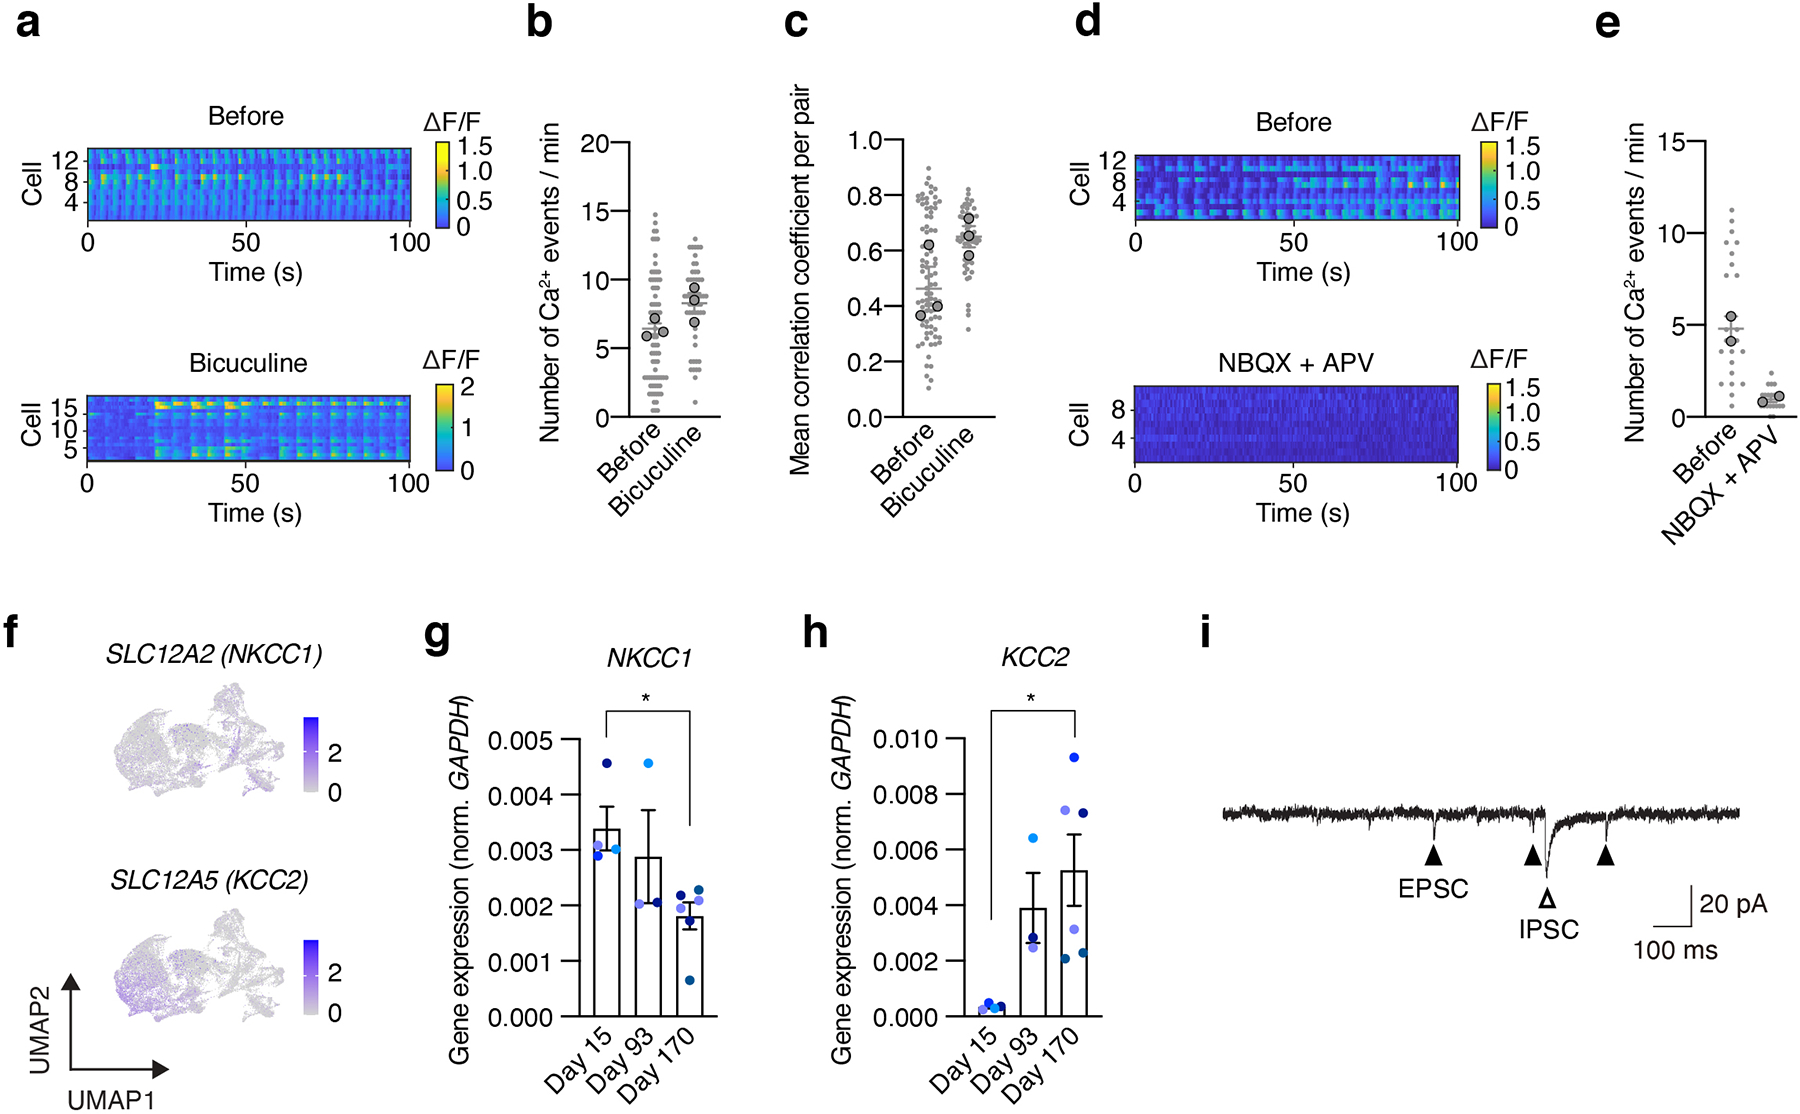
(a–e) Effect of bicuculine (50 μM) (a–c) and NBQX (20 μM) + APV (50 μM) (d,e) on calcium signals (GCaMP6s) in hStrS neurons at day 104. GCaMP6s was induced by iCre expression under a minipromoter that includes the regulatory region of the striatal gene GPR88 (Ple94). Heatmap showing ΔF/F of GCaMP6s signals. n = 74 cells before and n = 55 cells after bicuculine treatment in b; two-tailed, Mann-Whitney test, P = 0.09. n = 87 cells before and n = 56 cells after bicuculine exposure in c; two-tailed, unpaired t-test, P = 0.10. n = 25 cells before and n = 21 cells after NBQX + APV exposure in e. Data show mean ± s.e.m. (f) Expression of SLC12A2 and SLC12A5 in hStrS. (g,h) RT-qPCR for NKCC1 and KCC2. n = 4 neural spheroids from 4 hiPS cell lines at day 15, n = 3 neural spheroids from 3 hiPS cell lines at day 93, n = 6 neural spheroids from 3 hiPS cell lines at day 170; Kruskal-Wallis test, *P = 0.01, Dunn’s multiple comparisons test: *P = 0.02 for day 15 vs day 170 in NKCC1, one-way ANOVA, F3,12 = 4.38, P = 0.02, following Tukey’s multiple comparison test: *P = 0.04 for day 15 vs day 170 in KCC2. (i) Representative recording of spontaneous IPSC in hSyn1::eYFP expressing hStrS neurons at day 160. The 2242–1 hiPS cell line is shown in orchid blue, 8858–3 in blueberry blue, 1205–4 in midnight blue, 0524–1 in ocean blue, 0410–1 in aqua blue. Data show mean ± s.e.m.