
Extended Data Fig. 8. Characterization of cortico-striatal assembloids.
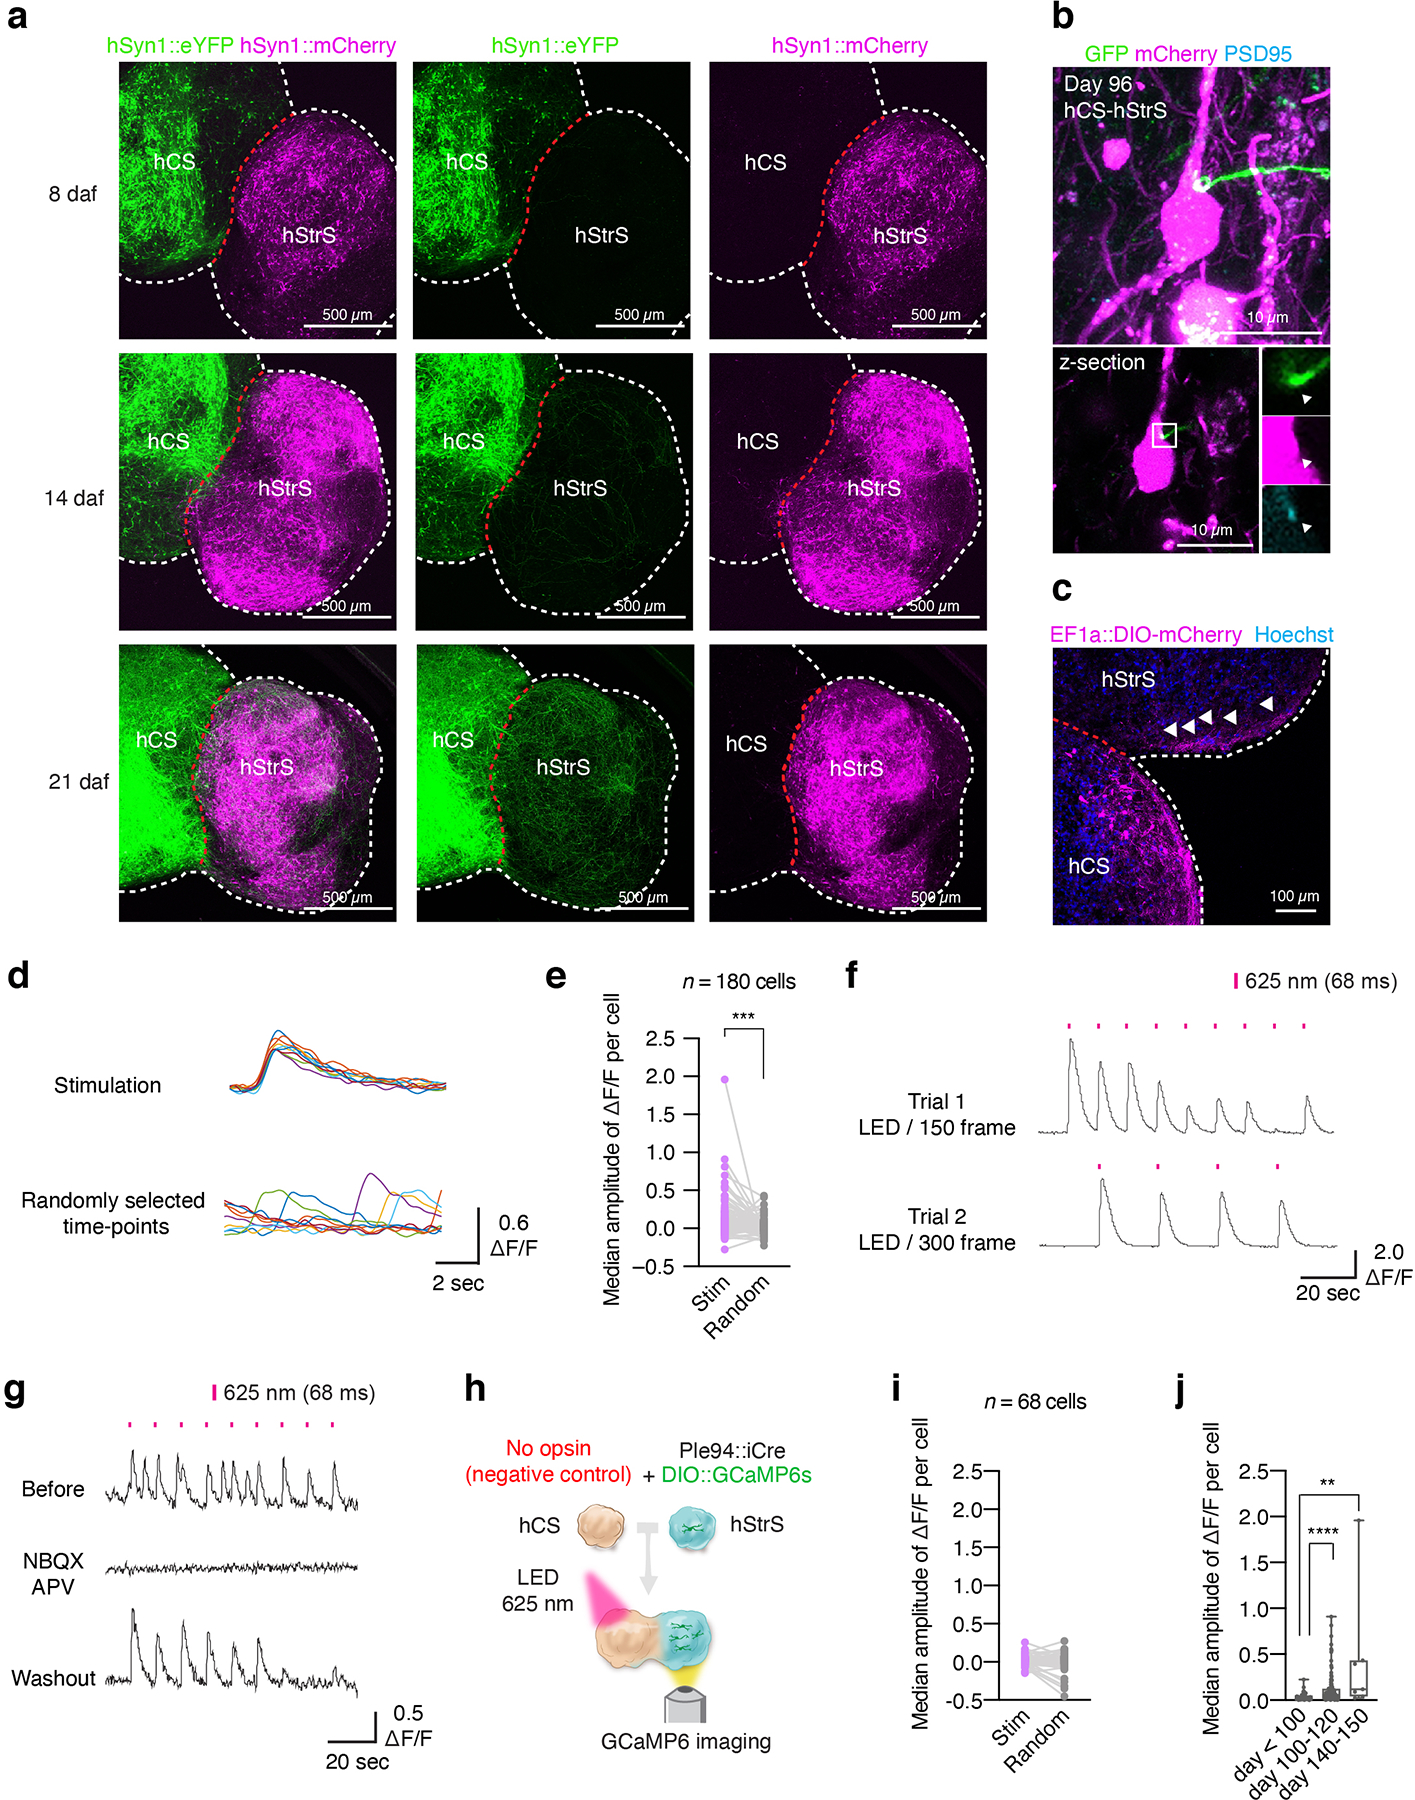
(a) Representative images of cortico-striatal assembloids at 8, 14, 21 days after assembly (daf). Scale bar: 500 μm. Imaging was repeated in assembloids from 2 independent differentiation experiments with similar results. (b) hCS neurons (Syn1::YFP+) projecting towards PSD95+ puncta on dendrites of mCherry+ hStrS neurons at day 96. Immunostainings were repeated in assembloids from 2 independent differentiation experiments with similar results. (c) mCherry+ projections from hCS in cortico-striatal assembloids (hCS was infected with a AAV-EF1a::DIO-mCherry; hStrS was infected with ΔG-Rabies virus-Cre-GFP and a AAV-EF1a::G). Scale bar: 100 μm. (d,e) Comparison of stimulus-triggered change in amplitude of ΔF/F of GCaMP6 signals to random time-locked ΔF/F in the same cell; (d) Representative traces of ΔF/F from real stimulation (top) and randomly selected time-points (bottom), and (e) quantitative results. n = 180 cells from 10 assembloids with 3 hiPS cell lines; two-tailed Wilcoxon test ***P = 0.0002. (f) Representative trace of ΔF/F of GCaMP6 signal at LED / 150 frame (top) and at LED / 300 frame (bottom). (g) Representative traces of GCaMP6s imaging and median amplitude of ΔF/F per cell before, during NBQX (20 μM) and APV (50 μM) treatment and after wash. Data show mean ± s.e.m. (h,i) Schematics of a control optogenetics coupled with calcium imaging experiment in cortico-striatal assembloids. Quantitative results of ΔF/F from a real stimulation and a randomly selected time-point at day 108. n = 68 cells from 3 assembloids derived from 2 hiPS cell lines; two-tailed Wilcoxon test, P = 0.33. (j) Quantitative results of ΔF/F from day 90 to day 145 cortico-striatal assembloids. n = 68 cells from 3 assembloids derived from 2 hiPS cell lines; Kruskal-Wallis test, ****P < 0.0001, Dunn’s multiple comparisons test: ****P < 0.0001 for day < 100 vs day 100–120, **P = 0.004 for day < 100 vs day 140–150. Data show mean ± s.e.m. Box plots show maximum, third quartile, median, first quartile, and minimum values.