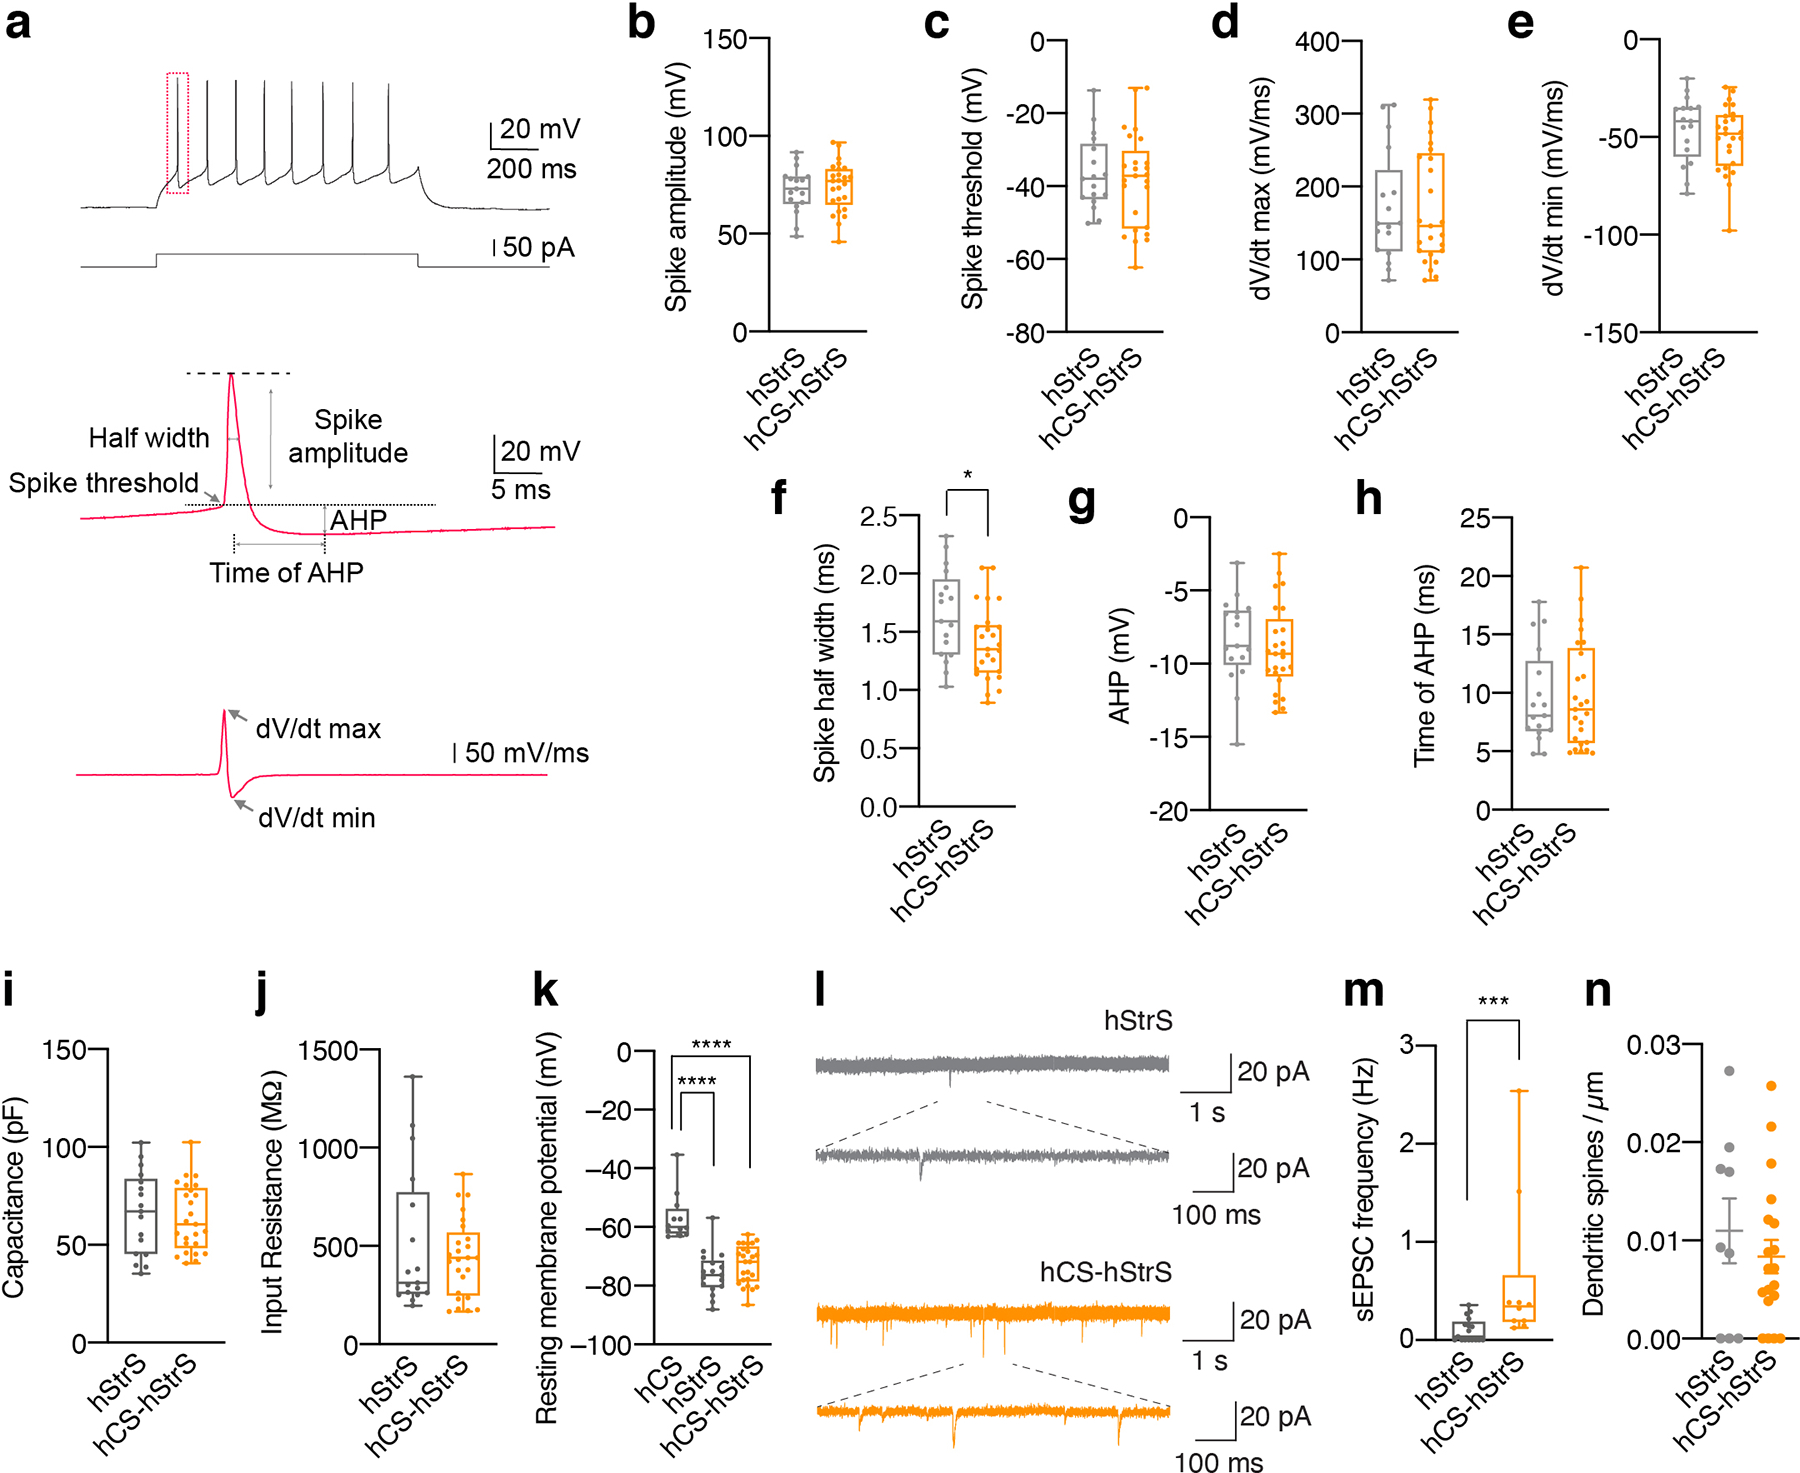
Extended Data Fig. 9. Electrophysiological characterization of cortico-striatal assembloids.

(a) Analyses on individual action potential traces in hStrS and hCS-hStrS neurons. (b) Quantification of spike amplitude, (c) spike threshold, (d) dV/dt max, (e) dV/dt min, (f) spike half width, (g) AHP, (h) time of AHP, (i) capacitance, (j) input resistance and (k) resting membrane potential in hCS, hStrS and hCS-hStrS neurons; n = 17 cells from hStrS, n = 25 cells from hCS-hStrS derived from 3 hiPS cell lines; two-tailed unpaired t-test P = 0.64 for b, two-tailed unpaired t-test P = 0.60 for c, two-tailed unpaired t-test P = 0.94 for d, two-tailed unpaired t-test P = 0.37 for e, two-tailed unpaired t-test *P = 0.02 for f, two-tailed unpaired t-test P = 0.53 for g, two-tailed unpaired t-test P = 0.87 for h, two-tailed unpaired t-test P = 0.68 for i, Mann-Whitney test P = 0.82 for j, Kruskal-Wallis test, ****P < 0.0001, Dunn’s multiple comparisons test: ****P < 0.0001 for hCS vs hStrS, ****P < 0.0001 for hCS vs hCS-hStrS, P = 0.80 for hStrS vs hCS-hStrS for k. (l) Representative traces of spontaneous EPSC (sEPSC) and (m) frequency of sEPSCs in hStrS and hCS-hStrS (n = 17 cells in hStrS, n =10 cells in hCS-hStrS from 3 hiPS cell lines; two-tailed Mann-Whitney test ***P = 0.0006. (n) Quantification of the number of dendritic spines (day 100–110: n = 9 neurons for hStrS, n = 27 neurons for hCS-hStrS from one hiPS cell line; two-tailed, Mann-Whitney test, P = 0.17).Data shown are mean ± s.e.m. Box plots show maximum, third quartile, median, first quartile, and minimum values.
