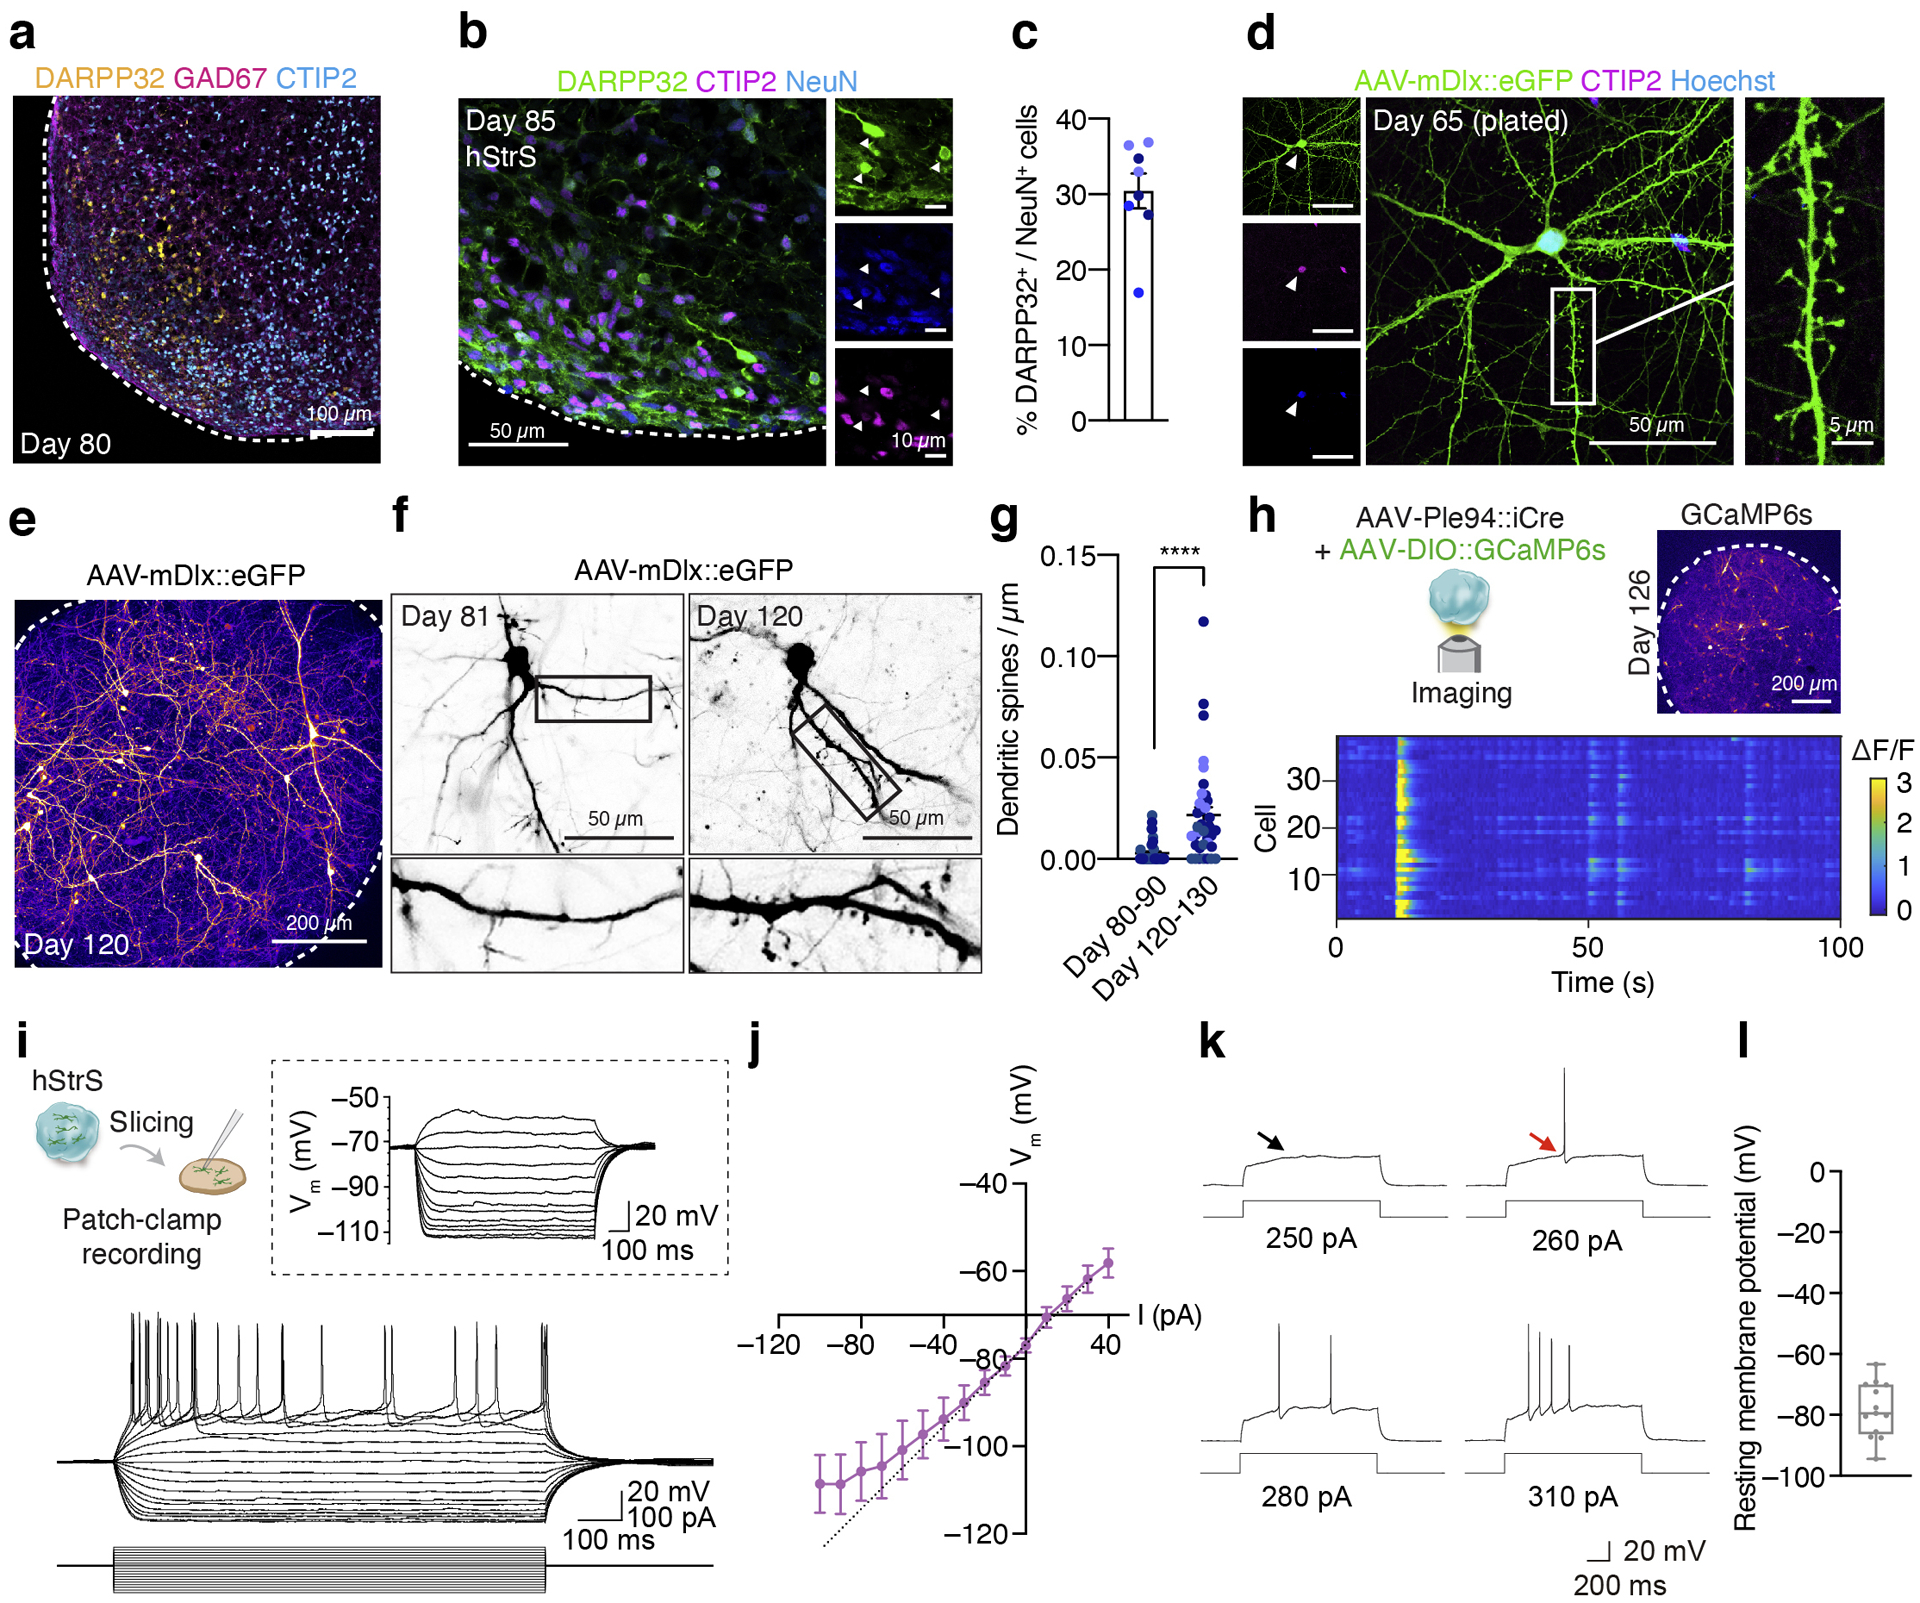
FIGURE 2. Characterization of 3D human striatal spheroids (hStrS).

(a) Immunostaining for DARPP32 (yellow), GAD67 (magenta) and CTIP2 (cyan) in hStrS at day 80. n = 5 hiPS cell lines. Scale bar: 100 μm. (b,c) Immunostaining for DARPP32 (green), CTIP2 (magenta), and NeuN (blue), and quantification of CTIP2+ and DARPP32+ cells in hStrS at day 85. n = 8 neural differentiation experiments of 3 hiPS cell lines. (d) Representative image showing dissociated hStrS cells labelled with AAV-mDlx::eGFP reporter, and. eGFP (green), CTIP2 (magenta), and Hoechst (blue). Scale bar: 50 μm (left) and 5 μm (right). Immunostainings were repeated in dissociated hStrS cultures from 4 independent differentiation experiments with similar results. (e–g) Dendritic spine morphology in the hStrS neurons labelled with AAV-mDlx::eGFP and quantification of number of dendritic spines (day 80–90: n = 40 neurons from 3 neural differentiation experiments of 2 hiPS cell lines; day 120–130: n = 38 neurons from 4 differentiation experiments of 3 iPS cell lines; two-tailed, Mann-Whitney test, ****P < 0.0001). (h) Calcium imaging of hStrS neurons expressing the genetically encoded calcium indicator GCaMP6s at day 126 of differentiation. GCaMP6s is induced by iCre expression under a minipromoter including regulatory region of striatal gene GPR88 (Ple94). Heatmap showing ΔF/F of GCaMP6s signal from 39 cells. Imaging was repeated in hStrS from 3 independent differentiation experiments with similar results. Scale bar: 200 μm. (i) Whole cell patch-clamp recording and representative membrane response of hSyn1::eYFP labeled hStrS neurons following intracellular current pulse injection. (j) Current-frequency (I-V) curve showing inward rectification in hSyn1::eYFP+ hStrS neurons (n= 17 cells from hStrS at day 110–120). (k) Representative traces showing slow-ramp depolarization of hSyn1::eYFP+ hStrS neurons at day 160. The black arrow indicates slow-ramp depolarization, the red arrow indicates delayed first spike. (l) Resting membrane potential (n = 13 cells from hStrS at day 160–170). Data show mean ± s.e.m. Box plots show maximum, third quartile, median, first quartile, and minimum values.
