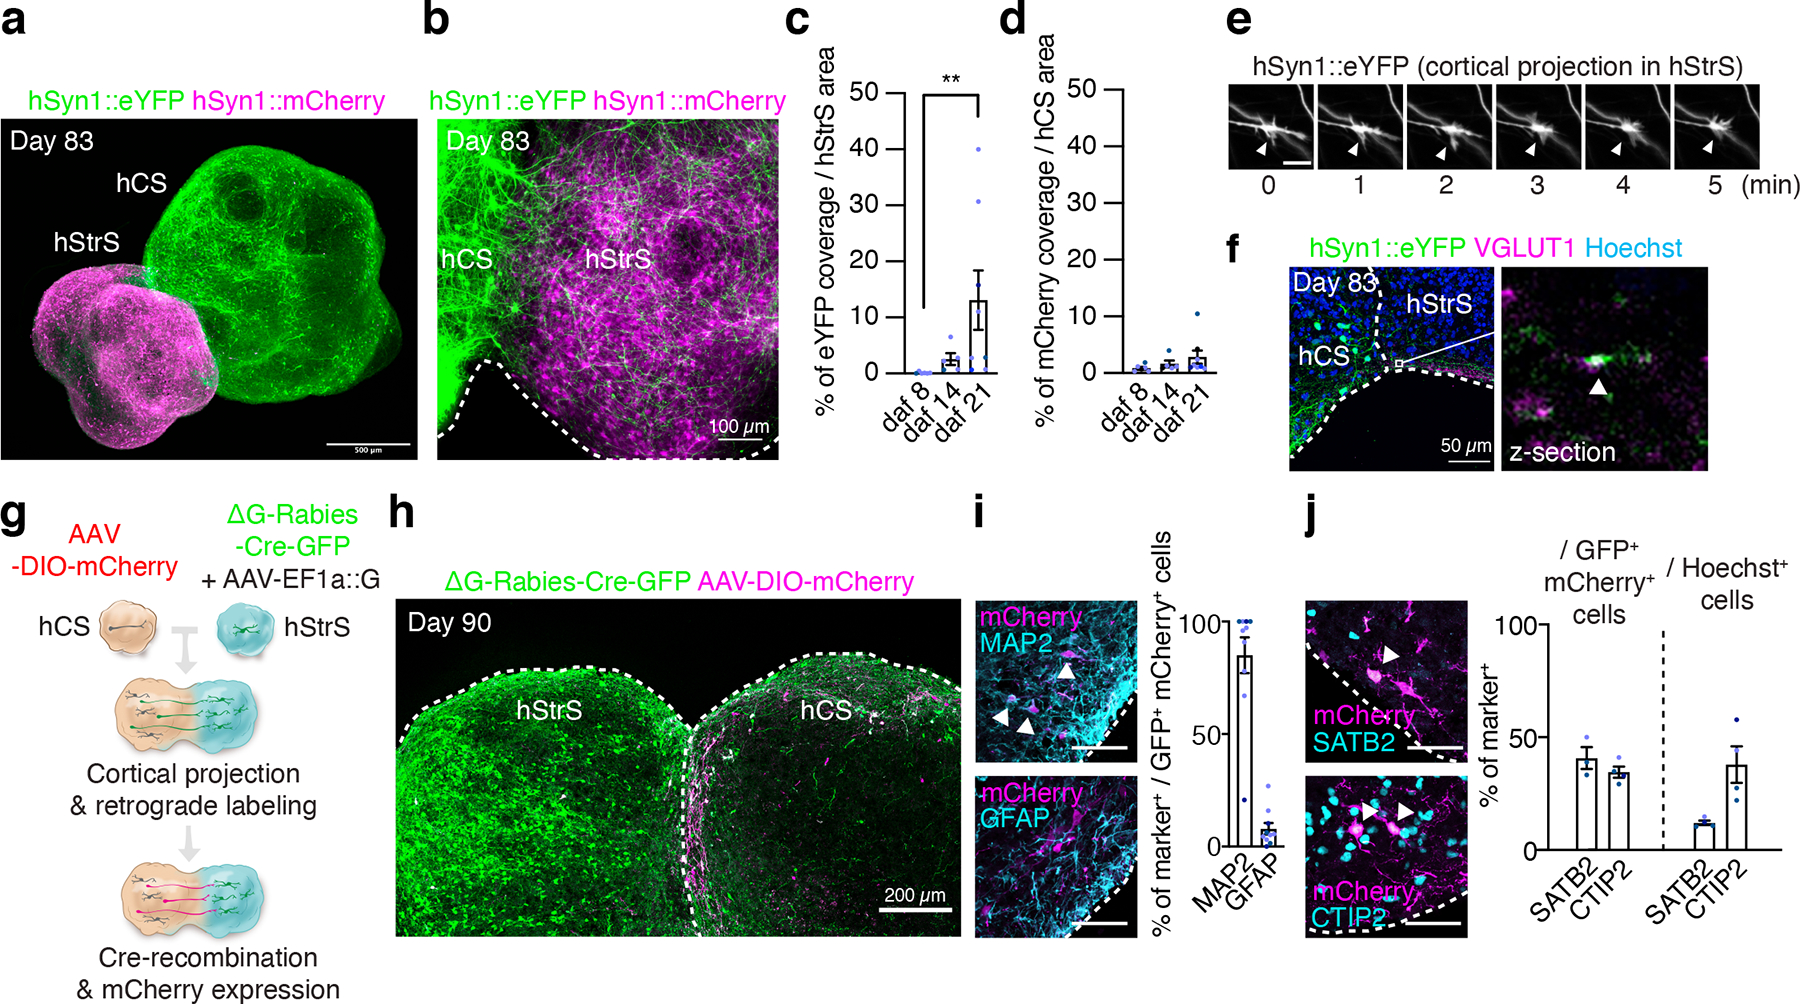
FIGURE 3. Generation of cortico-striatal assembloids.

(a) Three-dimensional immunostaining of CUBIC-cleared cortico-striatal assembloids expressing AAV-hSyn1::eYFP in hCS and AAV-hSyn1::mCherry in hStrS (day 83). Scale bar: 500 μm. (b) Axon projections (YFP+) from hCS into hStrS in cortico-striatal assembloids at 21 days after fusion (daf) (day 83 of differentiation). Scale bar 100 μm. (c) Quantification of percentage of eYFP fluorescence coverage per hStrS area, and (d) of mCherry fluorescence over hCS area. n = 6 assembloids for daf 8, n = 5 assembloids for daf 14, and n= 8 assembloids for daf 21; Kruskal-Wallis test, ***P = 0.0002, **P = 0.001 with Dunnett’s multiple comparison test for daf 21 versus daf 8 in c, and Kruskal-Wallis test, P = 0.17 for d. (e) Time lapse imaging in the hStrS side of cortico-striatal assembloids showing growth cones of hCS neurons labeled with eYFP. Arrow heads indicate the growth cone. Scale bar: 10 μm. Imaging was repeated in assembloids from 3 independent differentiation experiments with similar results. (f) Representative image showing glutamatergic terminal labeled with VGLUT1 in the hStrS side of cortico-striatal assembloids. Immunostainings were repeated in assembloids from 2 independent differentiation experiments with similar results. (g, h) Experimental design schematic and image showing retrograde viral labeling of projection neurons from hCS into hStrS using ΔG-Rabies-Cre-GFP virus. Cells labeled with AAV-DIO-mCherry in hCS that project to hStrS and receive the ΔG-Rabies-Cre-GFP retrogradely co-express GFP+ and mCherry+. Immunostainings were repeated in assembloids from 4 independent differentiation experiments with similar results. (i) Representative image and quantitative results showing percentage of neurons (MAP2+) and glial cells (GFAP+) that are retrogradely labeled (GFP+/mCherry+); n = 10 assembloids from 4 differentiation experiments of 3 hiPS cell lines. Scale bar: 50 μm. (j) Percentage of SATB2+ or CTIP2+ that are retrogradely labeled in the hCS side of assembloids (GFP+/mCherry+) (left), as compared to percentages of SATB2+ and CTIP2+ cells out of all cells in the same slice (right); n = 3 assembloids for SATB2+ / GFP+ mCherry+ cells, 4 assembloids for CTIP2+ / GFP+ mCherry+ cells, and 4 assembloids for SATB2+ and CTIP2+ / Hoechst+ cells from 2 differentiation experiments of 2–3 hiPS cell lines. Scale bar: 50 μm. Data show mean ± s.e.m.
